SAGE MOUNTAIN 945 East Paces Ferry Rd NE, Suite 2660, Atlanta, GA 30326
Sage Mountain Research
Market Update – Q3 2024
Q3 recap: continued market appreciation, coupled with volatility and new Fed movement.
The major development in 3Q24 was the Federal Reserve’s decision to cut interest rates by -0.50%, the first rate cut of this cycle. It came as the Fed shifted its focus, with unemployment rising to a 33-month high and inflation moving back to target. In the equity market, stocks ended the quarter higher despite some turbulence, including a brief but sharp sell-off in early August. The S&P 500 posted its fourth consecutive quarterly gain and ended September near an all-time high.
In 3Q24, the Fed started the process of normalizing interest rates after a volatile five years. The Fed cut interest rates to near-zero during the COVID pandemic to support the economy, and it kept rates near 0% until March 2022. From March 2022 to July 2023, the central bank raised rates by +5%, one of the largest and fastest rate-hiking cycles in recent decades. The Fed held interest rates steady for over a year as it waited for inflation to return to its 2% target, and after 14 months, it started the rate- cutting cycle with a -0.50% cut at its September meeting.
The Fed’s transition to cutting interest rates comes as its focus shifts from lowering inflation to supporting the labor market. Since the last rate hike in July 2023, inflation has dropped from 3.3% to 2.6%.
However, over the same period, unemployment has risen from 3.5% to 4.2%, the highest level since October 2021. The key question for the Fed and investors is what the labor market softening over the past year represents. Is the labor market simply normalizing after experiencing significant disruption during the pandemic, or is it an early sign of weakening labor demand?
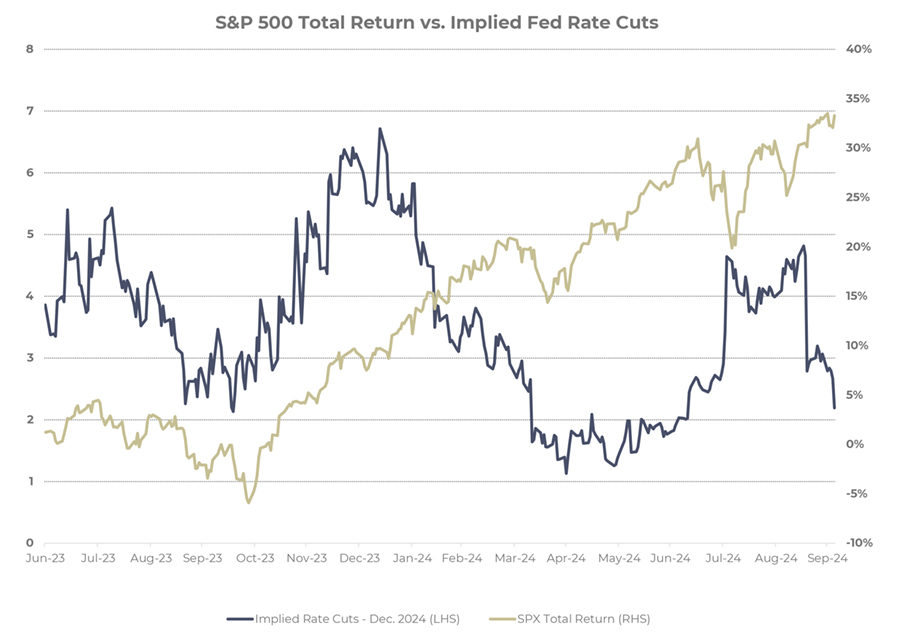
Investors expect the Fed to cut interest rates at its two remaining meetings this year, with further reductions expected throughout 2025. The market expects an additional -0.50% of rate cuts by the end of this year, followed by another -1.50% by the end of 2025. History indicates the actual timing and amount of rate cuts will depend on the economy’s path. A weaker economy would justify more rate cuts, while a stronger economy could require fewer rate cuts.
Higher interest rates appear to be weighing on manufacturing, housing, and loan growth. However, the main engine of the economy, the consumer, continues to spend. The data suggest that the current level of interest rates is restrictive, and the Fed’s goal in lowering rates is to stimulate interest-rate-sensitive sectors and prevent a deeper slowdown. Economists will monitor these data points in the coming months and quarters to gauge the impact of the Fed’s interest rate cuts on the economy.
In early August, the stock and bond markets experienced significant volatility. Signs of investor angst started to appear during earnings season in July, when investors raised concerns about the high costs of developing artificial intelligence (AI) and whether future revenues would justify the expensive investments. A few weeks later, investors were spooked as unemployment rose from 4.1% to 4.3%. Investors worried the Fed had waited too long to cut rates and risked tipping the U.S. economy into a recession that could be hard to reverse.
This sudden surge in market volatility caused investors to sell stocks and buy bonds, leading to a significant deleveraging event across global financial markets. The S&P 500 traded down nearly -8% from mid-July through the first week of August. However, the volatility was short-lived, and the S&P 500 rebounded to end August with a modest gain. There was some residual volatility in early September as investors returned from summer break, but the S&P 500 again recovered quickly and set a new all-time high later in the month. The rise in market volatility marks a significant shift from the past 12 months of steady S&P 500 gains, but so far, investors have brushed it aside.
Despite the volatility, the S&P 500 set multiple new all-time highs in 3Q24, adding to its list of new highs from earlier in the year.
However, it was the change in stock market leadership that made headlines. The Equal-Weighted S&P 500, the Russell 2000, and the Value factor all outperformed the S&P 500, while the Growth factor underperformed. The Technology sector lagged the market rally, ending the quarter flat after outperforming in the first half of the year.
Two key events, the Fed’s first interest rate cut in September and growing concerns about AI’s profitability, led to the change in market leadership in 3Q24. In the first half of 2024, uncertainty around Fed policy and concerns about the economy pushed investors toward large-caps and AI stocks. Meanwhile, smaller companies underperformed due to worries about their sensitivity to higher interest rates. With the Fed now officially cutting interest rates and doubts emerging about AI’s monetization potential, investors sought out new investment opportunities in 3Q24.
International stocks outperformed U.S. stocks in 3Q24 for the first time since 4Q22. International stocks benefited from two themes: a weaker U.S. dollar and AI companies’ underperformance during the stock market rotation. However, despite outperforming in 3Q24, the two major international indices are still underperforming year-to-date due to their lack of exposure to AI stocks.
In 3Q24, bonds traded higher as investors prepared for the start of the Fed’s rate-cutting cycle. The 10- year Treasury yield fell from 4.37% at the end of June to 3.79% at the end of September. The 2-year yield, which is a proxy for investors’ rate cut expectations, fell from 4.72% to 3.64% over the same period.
CCC-rated bonds, the lowest-rated and most sensitive to economic conditions, produced a total return of over +11% as corporate credit spreads tightened. The group’s outperformance suggests that investors expect interest rate cuts to stimulate economic growth and make refinancing easier. On the other end, AAA-rated bonds, the highest quality and most sensitive to interest rate changes, gained over +6% as the market priced in the first rate cut and yields fell. Together, the two groups’ outperformance indicates that investors expect rate cuts to boost economic growth and relieve pressure on highly leveraged companies.
Credit spreads remain tight by historical standards. The investment grade (IG) spread stands at 0.92%, meaning that investors are earning an extra +0.92% of yield by owning IG over similar Treasury bonds. Since 2004, the median IG spread has been 1.35%. The situation is similar for HY bonds, where the current spread is 3.14% compared to a median of 4.37%.
The takeaway is that corporate bond investors are receiving less yield compensation for taking on corporate credit risk compared to the past 20 years. Credit spreads are often used to gauge financial conditions and investor sentiment toward the economy. Today’s tight spreads signal economic stability, strong market liquidity, investor willingness to buy risky assets, and low perceived default risk.
Q4 outlook – themes to watch
With the Fed beginning to lower interest rates, investors are focused on what happens next. The two key questions are how much the Fed will cut interest rates and how the economy will respond to those rate cuts. The next six months will be critical in providing answers to these questions, and investors will analyze each economic data point for clues about the economy’s trajectory. This intense focus on economic data may have the unintended consequence of keeping market volatility elevated as investors flip between optimism and pessimism.
Historically, the S&P 500 has performed very differently depending on whether the economy falls into a recession after the first rate cut. When rate cuts stimulate economic growth, the S&P 500 gains an average of +23% over the next 12 months. However, if a recession follows, the S&P 500 produces an average return of -4%. Our team will monitor economic data in the coming months to see what impact interest rate cuts have on the economy.
As we wrap up this quarter’s market update, we want to briefly touch on the upcoming presidential election. With the election quickly approaching, you may be wondering how the outcome will affect financial markets and whether you should change your investment strategy.
Political views can stir strong emotions but making investment choices based on those feelings can lead to poor portfolio decisions. Data suggests that whichever party occupies the White House has little to no impact on investment performance, with fundamental factors like corporate earnings growth and valuations impacting the stock market far more than political headlines. The U.S. economy’s success, growth, and resiliency don’t change with each new election, and neither should your long-term investment strategy.
Market Snapshot

Investment grade fixed income saw strong positive gains in Q3, as investors prepared for the start of the Fed’s rate-cutting cycle.
Despite the volatility, the S&P 500 set multiple new all-time highs in 3Q24, adding to its list of new highs from earlier in the year.
However, it was the change in stock market leadership that made headlines. The Equal- Weighted S&P 500, the Russell 2000, and the Value factor all outperformed the S&P 500, while the Growth factor underperformed.
A 60% equity / 40% bond portfolio rose +5.6% in Q3, and +15.0% for the year driven by positive fixed income and equity returns.
Plenty happened in 2024…but equity markets continued along…
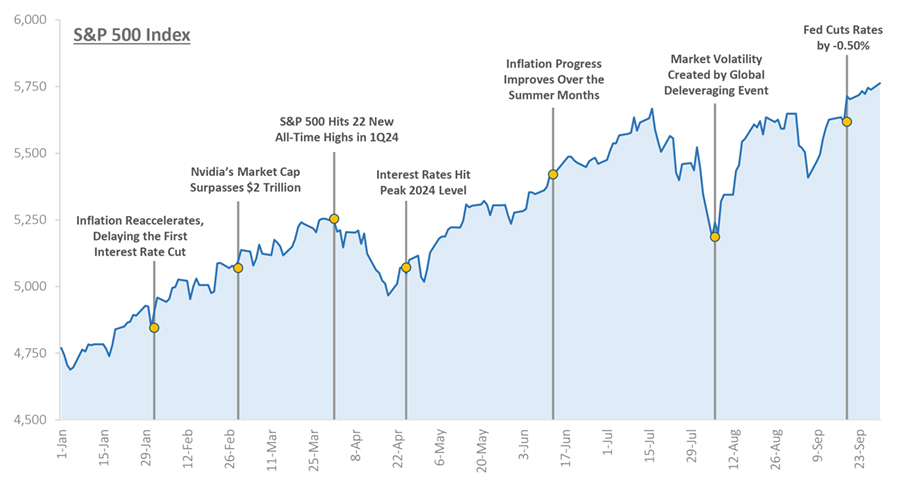
Source: Standard & Poor’s, Department of Labor, U.S. Treasury, Federal Reserve. Analysis is based on price and does not reflect any management fees, transaction costs, or expenses. Past performance does not guarantee future results. Time period from 1/1/2024 to 9/30/2024. Latest available data as of 9/30/2024.
Valuations continued to rise, as stocks continued to climb with less concentration driving the market
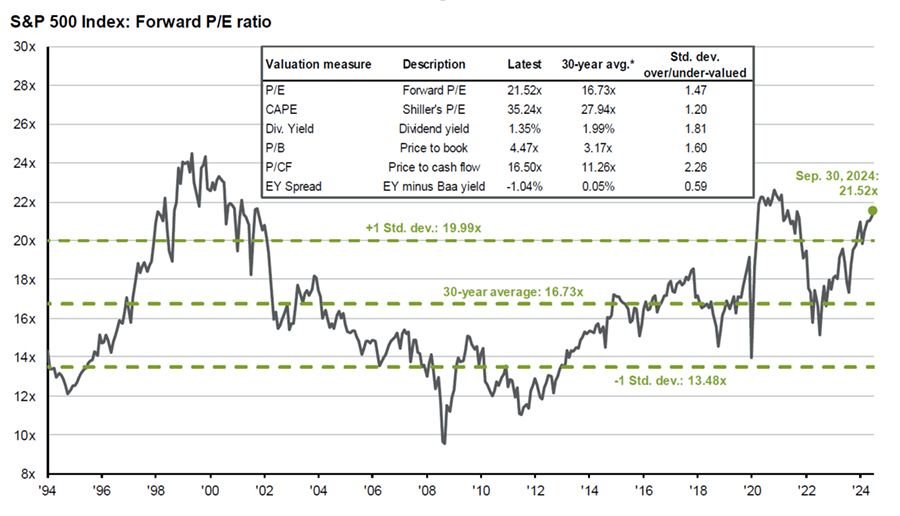
Price-to-earnings is price divided by consensus analyst estimates of earnings per share for the next 12 months as provided by IBES since March 1994 and by FactSet since January 2022. Average P/E and standard deviations are calculated using 30 years of history. Shiller’s P/E uses trailing 10-years of inflation-adjusted earnings as reported by companies. Dividend yield is calculated as the next 12-months consensus dividend divided by most recent price. Price-to-book ratio is the price divided by book value per share. Price-to-cash flow is priced divided by NTM cash flow. EY minus Baa yield is the forward earnings yield (consensus analyst estimates of EPS over the next 12 months divided by price) minus the Moody’s Baa seasoned corporate bond yield. Std. dev. over-/under-valued is calculated using the average and standard deviation over 30 years for each measure. Data as of June 30, 2024.
2024 has seen a broadening out in stock participation
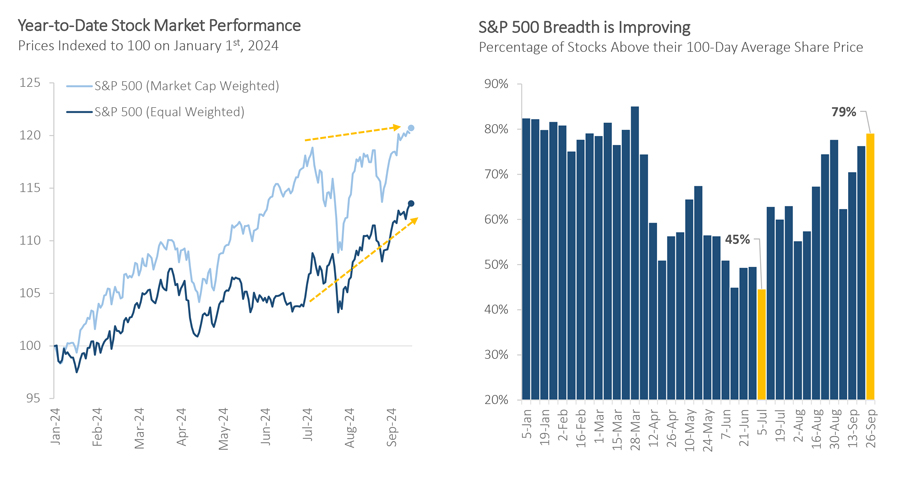
Source: Standard & Poor’s. Analysis is based on price returns and does not reflect any management fees, dividends, transaction costs, or expenses. Past performance does not guarantee future results. Time period from 1/12024 to 9/30/2024. Latest available data as of 9/30/2024.
While international stocks outperformed in Q3, they still lag well behind US stocks over the past 5 years
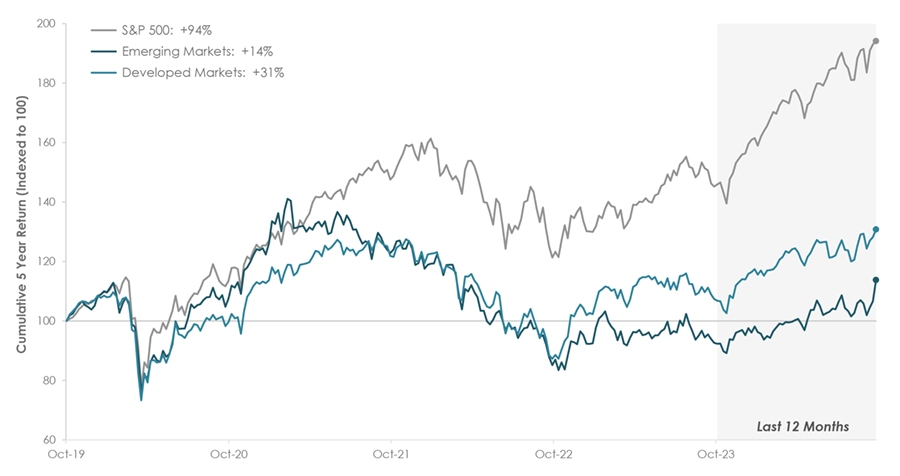
Disclosures: Past performance is no guarantee of future results. All performance data represents price returns for the stated period. S&P 500: SPDR S&P 500 ETF Trust (SPY), Emerging Markets: iShares MSCI Emerging Markets ETF (EEM), Developed Markets: iShares MSCI EAFE ETF (EFA).
All eyes have been on the Federal Reserve…
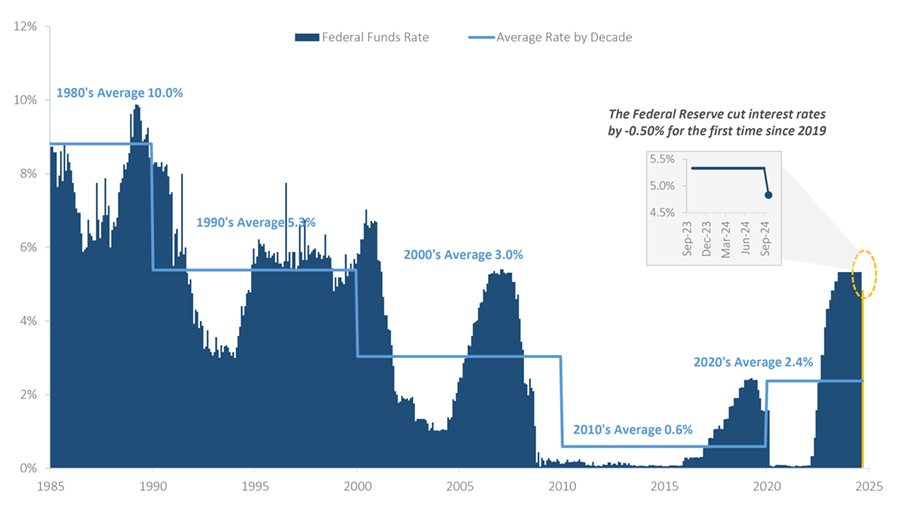
Source: Monthly datapoints from the Federal Reserve since the 1980s. The Federal Funds Rate is the target interest rate set by the Federal Reserve at which commercial banks borrow and lend excess reserves overnight. Time period from 1/1/1985 to 9/30/2024. Latest available data as of 9/30/2024
…But what should we expect for rates going forward?
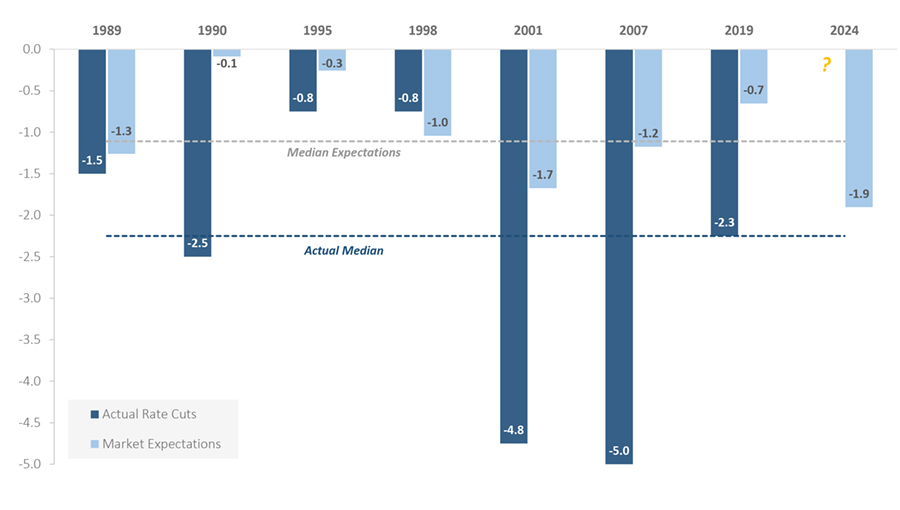
Source: Federal Reserve, U.S. Treasury. Market expectations are calculated as the 2-year Treasury yield minus the Fed funds rate the day before the first rate cut. Previous rate cutting cycles include June 1989, July 1990, July 1995, September 1998, January 2001, September 2007, and July 2019. Past performance does not guarantee future results. Latest available data as of 9/30/2024.
And what does this mean for equity markets?
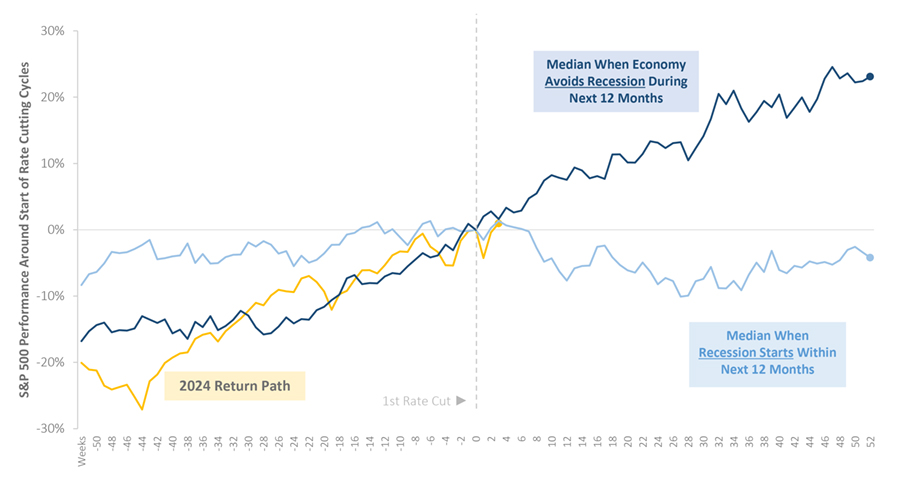
Source: Standard & Poor’s, Federal Reserve. Previous rate cutting cycles include June 1989, July 1990, July 1995, September 1998, January 2001, September 2007, and July 2019. Based on S&P 500 price returns 52 weeks before and after the first rate cut of the cycle. Past performance does not guarantee future results. Latest available data as of 9/30/2024.
Equity market returns have decoupled from expectations for Fed rate cuts
Strategists expect a small decline in the S&P 500 through year end…
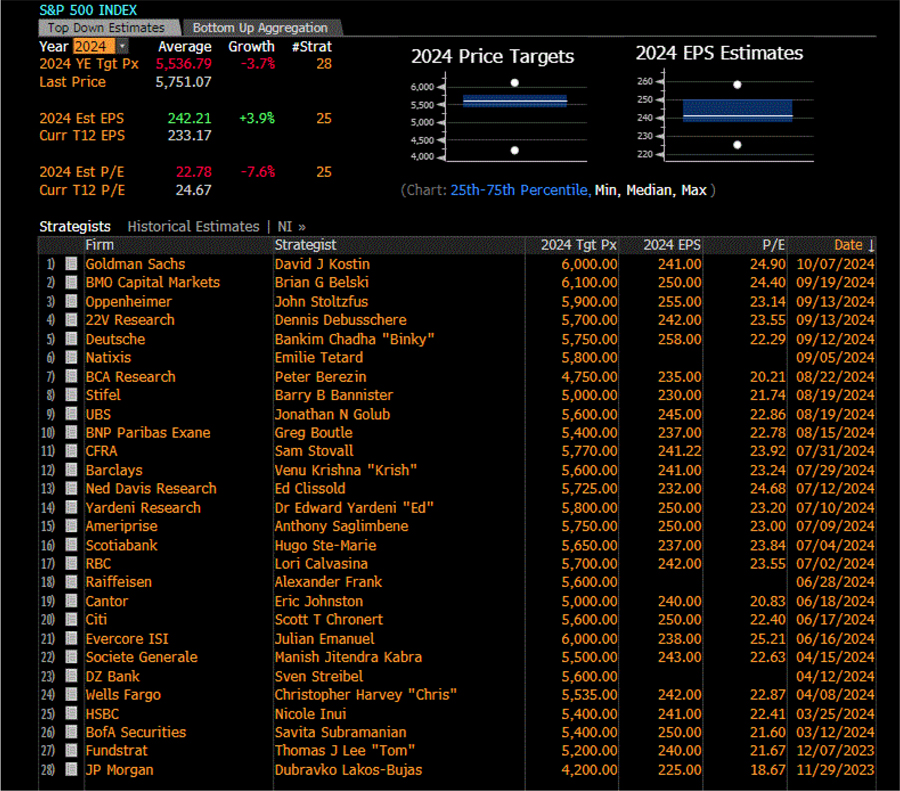
Source: Bloomberg
…and a slight increase through year end 2025, coupled with strong earnings growth
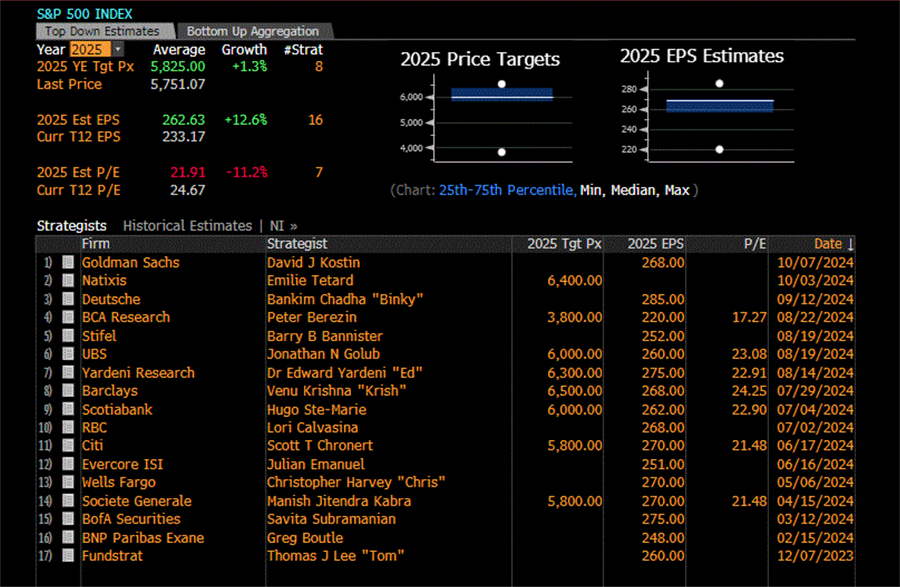
Source: Bloomberg
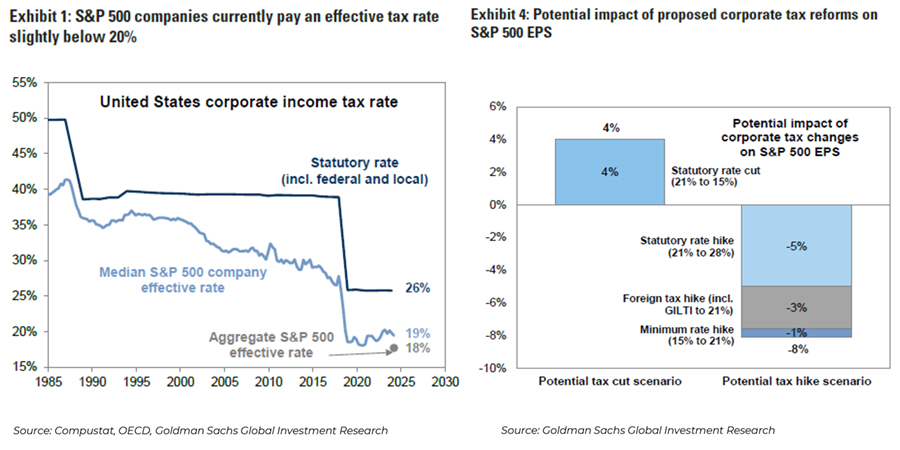
Looking ahead, what could corporate tax reform mean for S&P 500 earnings?
Inflation has improved while the labor market has weakened and the US consumer has remained solid
| Category | Economic Datapoint |
|---|---|
| Labor | Nonfarm Payrolls (000s) Unemployment Rate (%) Average Workweek (Hours) Average Hourly Earnings (y/y%) Jobless Claims – Initial (000s) Jobless Claims – Continuing (Millions) Job Openings (Millions) |
| Consumer | Personal Income (y/y%) Retail Sales (y/y%) Domestic Auto Sales (y/y%) Consumer Confidence Index Michigan Confidence Index |
| Housing | New Home Sales (y/y%) Housing Starts (y/y%) Building Permits (y/y%) Homebuilder Sentiment Index Monthly Supply (# of months) National Home Price Index ($000s) |
| Business | Leading Economic Index (y/y%) NFIB Small Business Index Manufacturing PMI Services PMI Industrial Production (y/y%) Capacity Utilization (%) |
| Inflation | Headline CPI (y/y%) Core CPI (y/y%) Headline PCE (y/y%) Core PCE (y/y%) Producer Price Inflation (y/y%) |
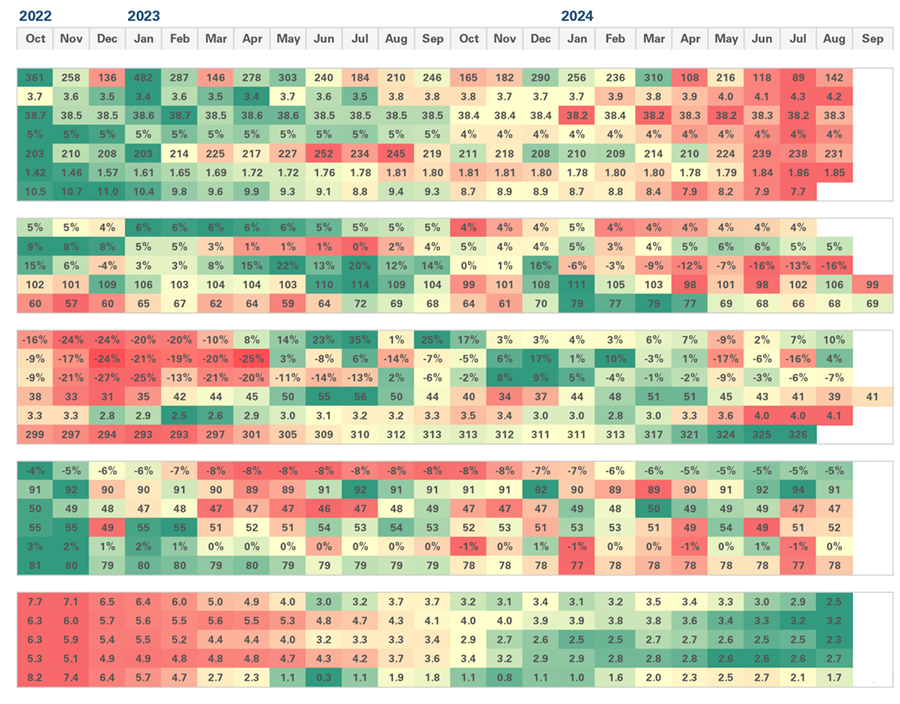
Disclosures: Data sourced from Federal Reserve, NBER, Redbook, Institute for Supply Management, University of Michigan, DOL, U.S. Census Bureau, NAHB. Red = Worst (5th percentile). Green = Best (95th percentile)
CPI vs. PPI
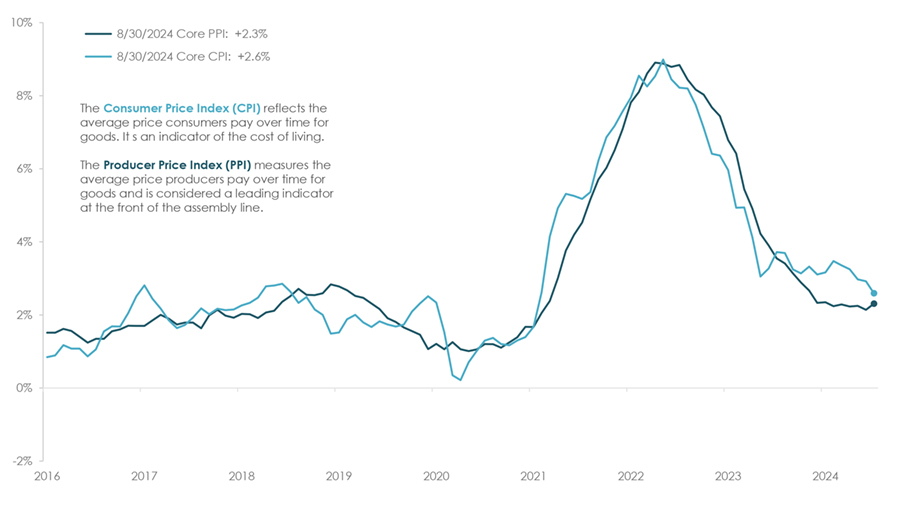
Disclosures: Data sourced from the Federal Reserve, U.S. Bureau of Labor Statistics. The Consumer Price Index (CPI) measures the changes in the price level of a basket of consumer goods and services purchased by households. The Producer Price Index (PPI) measures the average changes in prices received by domestic producers for their output (based on Final Demand: Finished Goods Less Foods and Energy).
Unemployment rate & job openings
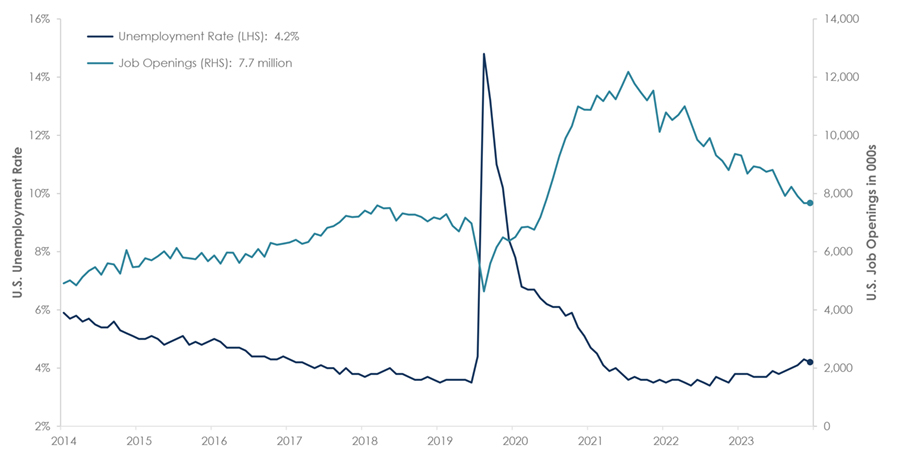
Disclosures: The Unemployment Rate represents the number of unemployed as a percentage of the labor force. Labor force data is restricted to people 16 years of age and older, who currently reside in 1 of the 50 states or the District of Columbia, who do not reside in institutions (e.g., penal and mental facilities, homes for the aged), and who are not on active duty in the Armed Forces. Job Openings (Total Nonfarm) is provided by the U.S. Bureau of Economic Analysis (St. Louis Federal Reserve identifier: JTSJOL). Data sourced from Federal Reserve and U.S. Bureau of Economic Analysis. RHS = right hand side. LHS = left hand side.
Labor markets – weakening, but not weak by historical standards
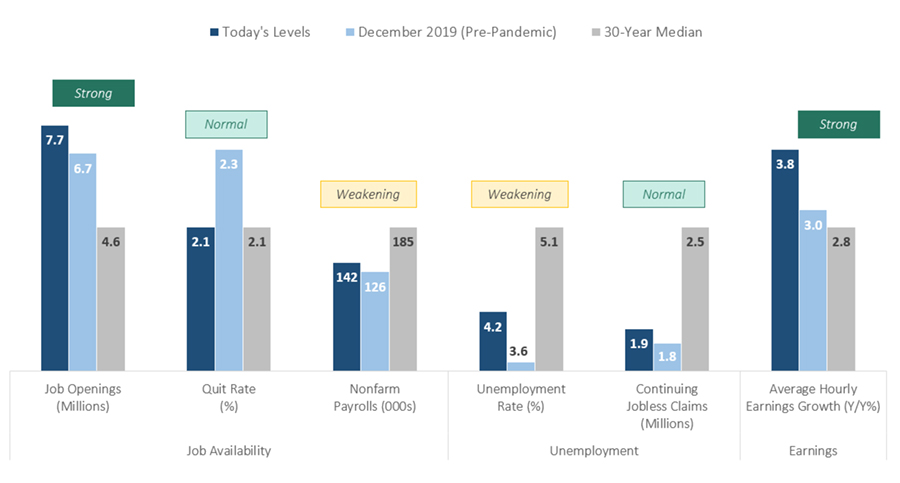
Source: Department of Labor. The 30-year median is based on monthly datapoints since 8/30/1994. Latest available data as of 9/30/2024.
Retail sales & personal finances
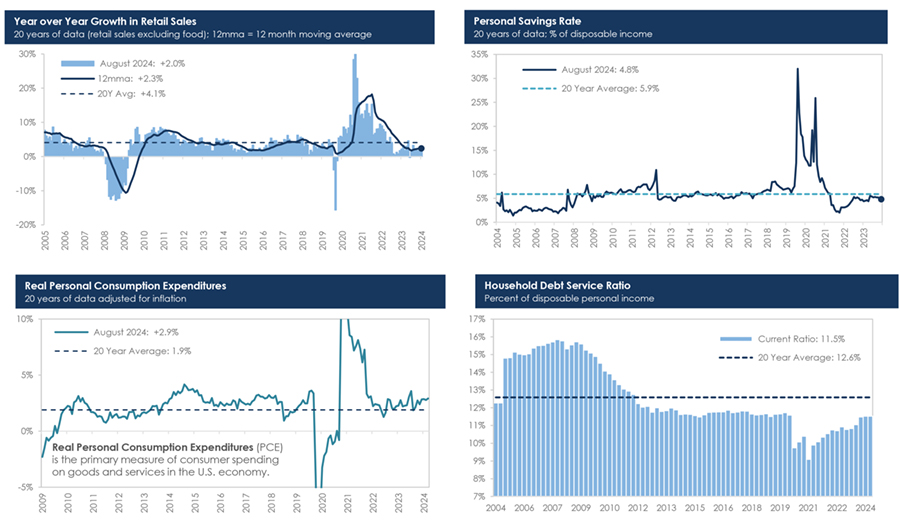
Disclosures: Data sourced from U.S. Bureau of Economic Analysis, U.S. Census Bureau, and the Federal Reserve.
Economic trends – watching interest rate sensitive industries
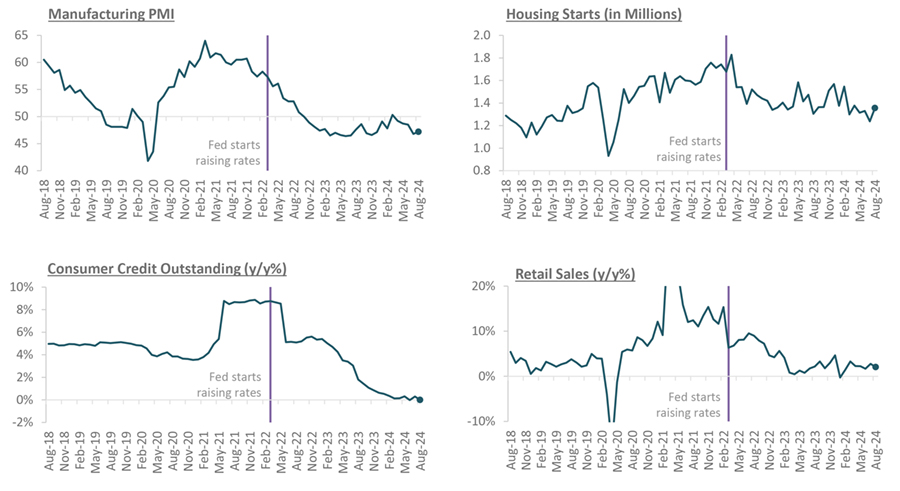
Source: Federal Reserve, Institute of Supply Management, U.S. Census Bureau. Time period from 8/31/2018 to 8/31/2024. Latest available data as of 9/30/2024.
What we’re monitoring – number of companies mentioning “recession”
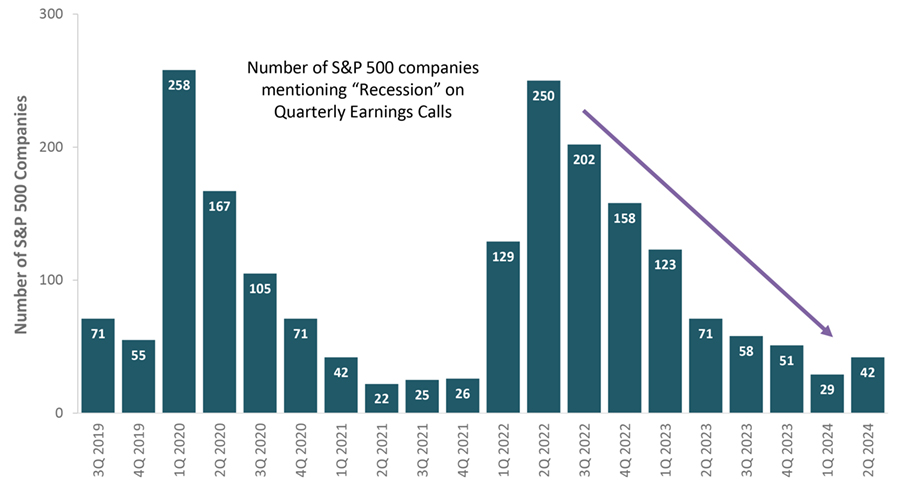
Source: Various quarterly corporate earnings calls. Time period from 6/30/2019 to 9/30/2024. Latest available data as of 9/30/2024.
U.S. Treasury yield curve
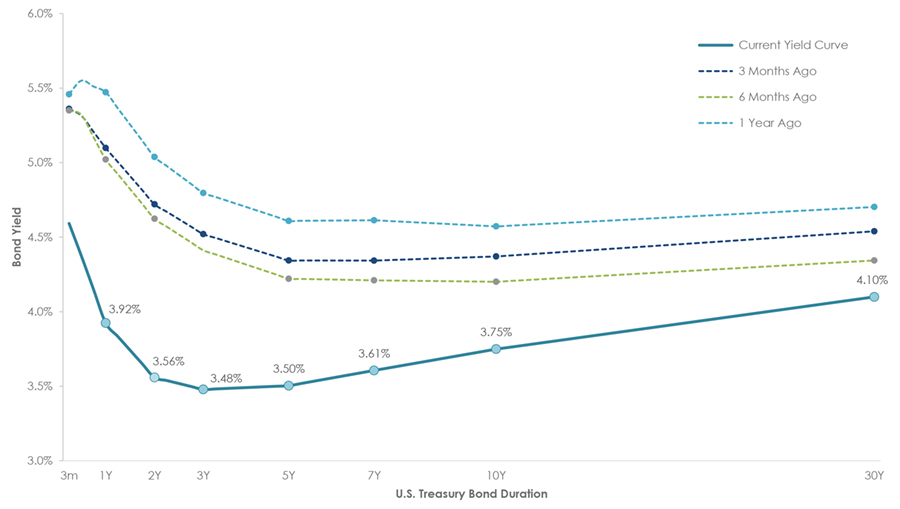
Disclosures: Data based on latest available data sourced from Federal Reserve. The yield curve shows the relationship between interest rates and time-to-maturity.
Do politics drive equity markets?
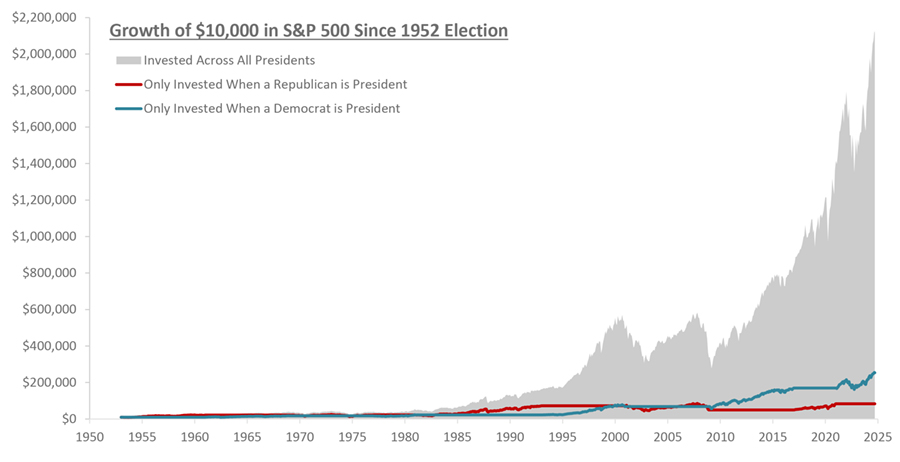
Source: MarketDesk, Standard & Poor’s, www.WhiteHouse.gov. Analysis is based on price returns and does not reflect any management fees, transaction costs, or expenses. Assumes an investor only invests in the S&P 500 when a Republican or Democrat President is in the White House. Past performance does not guarantee future results. Data from 1/1/1953 to 9/30/2024. Latest available data as of 9/30/2024.
Disclosures
Past performance is not indicative of future results. Sage Mountain Advisors, LLC (“SMA”) is an independent SEC registered investment advisor. Any reference to or use of the terms “registered investment adviser” or “registered,” does not imply that SMA or any person associated with SMA has achieved a certain level of skill or training. This material is provided for informational and educational purposes only.
Any subsequent, direct communication by SMA with a prospective client shall be conducted by a representative that is either registered or qualifies for an exemption or exclusion from registration in the state where the prospective client resides. For more information pertaining to the registration status of SMA, please contact SMA or refer to the Investment Adviser Public Disclosure website (www.adviserinfo.sec.gov). The information contained herein should not be construed as personalized investment, tax, or legal advice. Certain information contained in this presentation has been derived from third party sources. While we believe these sources to be reliable, we make no representations as to the accuracy, timeliness, and completeness of any such information prepared by any unaffiliated third party incorporated herein, and take no responsibility therefore. As such, there is no guarantee that the views and opinions expressed in this presentation will come to pass.
All investments carry a certain degree of risk of loss, and there is no assurance that an investment will provide positive performance over any period of time. The statements contained herein reflect opinions, estimates and projections of SMA as of the date hereof, and are subject to change without notice. SMA reserves the right to modify its current investment strategies and techniques based on changing market dynamics or individual portfolio needs. The opinions expressed herein are those of SMA and are subject to change without notice. Information presented should not be considered as a solicitation or recommendation to buy or sell any security, financial product, or instrument discussed herein. Additionally, this material contains certain forward-looking statements which point to future possibilities. Due to known and unknown risks, other uncertainties and factors, actual results may differ materially from the results portrayed or implied in such forward-looking statements. Furthermore, the illustrative results presented in this presentation in no way reflect the performance of any SMA product or any account of any SMA client, which may vary materially from the results portrayed for various reasons, including but not limited to, investment objectives, financial situations and financial needs of SMA clients; differences in products and investment strategies offered by SMA; and other factors relevant to the management of SMA client accounts.
This presentation and its contents are provided “as is” without warranty of any kind, express or implied, including, but not limited to, implied warranties of merchantability, fitness for a particular purpose, title, non-infringement, security, or accuracy. SMA reserves the right to modify its current investment strategies and techniques based on changing market dynamics or client needs. It should not be assumed that any of the security transactions, holdings or sectors discussed were or will prove to be profitable, or that the investment recommendations or decisions we make in the future will be profitable or will equal the investment performance of the securities discussed herein. Actual investment advisory fees incurred by clients may vary. A complete description of SMA’s fee schedule can be found in Part 2 of its FORM-ADV which is available at www.sagemountainadvisors.com or by calling (404) 795-4861. Clients are advised that no portion of the services provided by SMA should be interpreted as legal, tax or accounting advice. For legal and tax-related matters, we recommend that you seek the advice of a qualified attorney, accountant or tax professional. SMA-24-0172