SAGE MOUNTAIN 945 East Paces Ferry Rd NE, Suite 2660, Atlanta, GA 30326
Sage Mountain Research
2024 Market Update & 2025 Outlook
2024 Recap & Themes for 2025
It is reasonable to expect lower returns from US equities over the next 5-10 years given high starting valuations…
…but valuations are a poor predictor of short-term returns Stay disciplined and focus on your long-term goals
Rebalance to your target weight in equities, as appropriate, and continue to overweight US.
Allocate to alternatives to increase diversification and provide additional potential sources of return. We continue to seek strong risk adjusted return opportunities, that strike a balance between current income and growth potential.
Market Snapshot

In a reversal from Q3, Investment grade fixed income fell in Q4 as inflation concerns remain, while high yield continued to outpace credit as spreads remained tight.
US Equities continued their rise as investors remain optimistic, while international stocks fell. The S&P 500 rose 2.4%, while international stocks fell -8.1% on the back of a strong US Dollar.
Oil returns were boosted by the Trump victory in Q4, rising 5.4%. The US Dollar reversed from Q3, rising 7.6% in the fourth quarter and bringing its year-to-date return back positive to 7.1%.
Volatility rose in Q4 as inflation cautions remain, bringing 2024 volatility to a sharp high of 39.4%, a strong reversal from 2023.
A 60% equity / 40% bond portfolio was flat in Q4, posting a 0.2% return as stock and bond returns were mixed.
2024 RECOMMENDATIONS IN HINDSIGHT
FIXED INCOME
Recommendations included extending fixed income duration, tactically allocating to AAA CLOs, and eschewing high yield corporate bonds in favor of other opportunities due to their tight credit spreads.
Adding duration was a drag on returns as rates increased on longer maturity bonds. The Bloomberg Municipal 1-10 Year Blend index returned +0.9% while the Bloomberg Municipal Bond 1 Year index returned +2.7%.
The allocation to AAA CLOs was additive as the JP Morgan CLO AAA Index returned +7.1% vs. the Bloomberg US Aggregate +1.3%.
High yield corporate bonds rallied as spreads tightened even further, but our allocations to BDCs and direct lending also performed well. The Bloomberg US Corporate High Yield index was +8.2% for the full year and +8.0% through the third quarter. The Cliffwater BDC Index returned +14.4% for the year while the Cliffwater Direct Lending Index returned +8.53% through Q3, the most recent quarter for which data is available.
EQUITIES
Recommendations included staying invested, maintaining a 4:1 overweight of US vs. international equities, and a quality factor tilt.
Remaining invested paid off as global equities returned +18.0%. Overweighting US was also beneficial as the S&P 500 returned +25.0% vs. the MSCI EAFE +3.8% on an unhedged basis and +11.3% currency hedged.
The quality factor tilt was a minor detractor from returns as the JP Morgan US Quality Factor Index returned +21.2% and the MSCI World ex USA Sector Neutral Quality Index was +2.1%.
ALTERNATIVES
We recommended allocating to alternatives to increase diversification and provide additional potential sources of return. Areas we mentioned included private credit, real estate credit, and secondaries as well as remaining open to strategies that could benefit if interest rates fall.
As with 2023, alternatives generally lagged relative to equities. However, we believe that the added diversification will benefit portfolios long-term assuming equity returns moderate after two very strong years.
We continued to add to secondaries exposure in real estate and credit with two funds that held their final close in 2024. We also committed to a life sciences venture capital fund which we believe is well positioned to take advantage of valuations which have rationalized from the peaks of 2020 and 2021.
Within primary market real estate, we continued to lean towards credit, allocating to multiple funds with a mix of fixed and floating rate exposure. While floating rate has ALTERNATIVES, cont. benefitted as the Fed raised rates in 2022 and 2023, we believed it made sense to lock in some fixed rate exposure as a complement and a hedge against future rate cuts.
A final notable investment was in an energy fund which focuses on proved developed producing wells and hedges most of the commodity price risk. We have largely avoided energy funds because we are not comfortable with their exposure to volatile commodity prices, so we are excited about this opportunity. We view this as a way to take advantage of a lack of capital in the space, as well as another investment which we believe can generate income that is not dependent on interest rates remaining near current levels.
US GDP growth remained strong

US productivity growth continued to lead the world
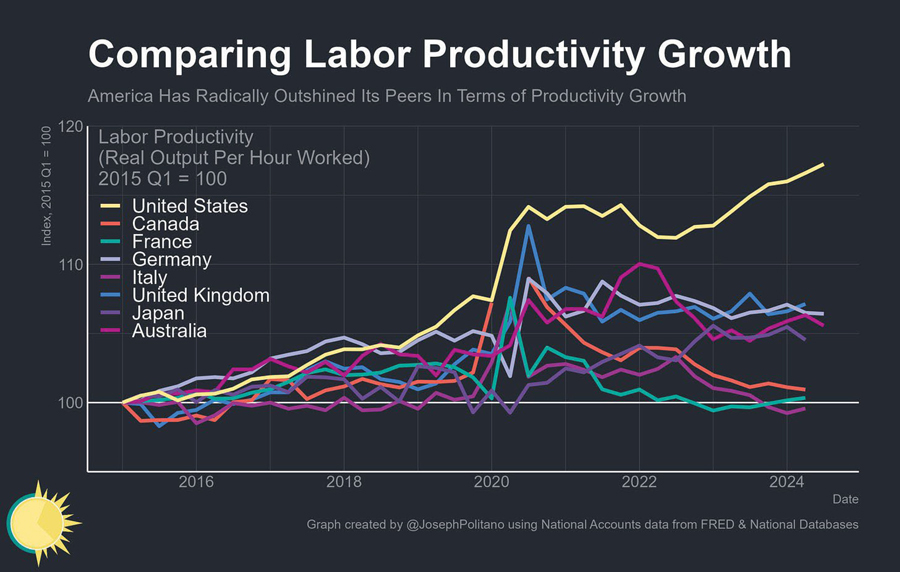
Source: Apricitas Economics
The shape of the yield curve shifted throughout the year

Long-term rates have increased despite Fed rate cuts

Bond volatility was high while equity volatility was low

Forecasting equity returns is very difficult…

…and US equities outperformed expectations again…

…despite fewer rate cuts than expected…

…and the S&P 500 set more than 50 all time highs in 2024

Bitcoin and AI were big winners in 2024

Mag 7 dominance continued in 2024…

…but that may be poised to change
While earnings have continued to be in favor of the Magnificent 7, there are macro economic factors that could benefit the S&P 493 in earnings growth. U.S. economic growth and trade policy could narrow the gap as we look ahead to a second Trump administration.

Valuations continued to trickle upward above historical averages…

…but valuations are a poor predictor of short term returns…

…and over the long run, stock prices track earnings

US equity returns have been remarkably consistent over different time periods

US equities have outperformed expectations for many years

Benchmark turnover makes forecasts more difficult

Two quotes from Goldman Sachs research:
“It is challenging, and arguably impossible, to forecast with accuracy the long-term return of an index when firms that may be added to the benchmark in the not-too-distant future may not yet have been founded.”
“The index is continually reconstituted and less successful companies are replaced by new firms that may have better growth prospects. If faster growing and more profitable companies enter and remain in the index during the next decade, returns would be boosted as the index would benefit from an improvement in its overall growth and profitability profile.”
Even in decades with poor returns, there have been several years with positive returns…

…and 10 year returns are very dependent on timing

History doesn’t repeat itself, but it often rhymes

Investing based on politics is a bad idea

Asset Class Recap & Recommendations
Outlook remains mostly positive

Money market funds have seen record flows & assets
Following the fastest Federal rate hikes in decades, money market funds saw record inflows since 2022. While yields on money market funds remain high, investors continue to hold for yield and safety purposes with their portfolios. Contrarily, the record flows also offer potential for cash to “come off the sidelines” in a variety of asset classes if opportunities seem ripe.

Bonds return flat but yield remains strong
After the worst year for fixed income in over 40 years, bonds bounced back in 2023 with broad positive returns. Following 2023, 2024 saw mixed results despite the Fed easing and rates being cut three times. With inflation stuck just below 3%, bond prices did not see the price appreciation many expected from a full percentage point in rate cuts. Despite muted performance, bonds across the board are offering attractive yields for investors, which does work as an advantage to bondholders to provide a cushion.

Yields remain high above 10-year norms

Short to intermediate duration still offers reward
After a historic rise in interest rates, following the rapid inflation in 2022, we recommended extending duration from short to intermediate in the 4th quarter of 2023. Interest rates saw a shift from tightening to easing as the Fed lowered rates by one full percentage point.
As interest rates fell, bond prices responded in kind; however, continued strong economic data gave rise to caution from the Fed and investors that drove some rates back up.
The table to the right shows the risk/reward trade-off continues to favor the short to intermediate part of the curve.

Municipal bonds offer attractive yields
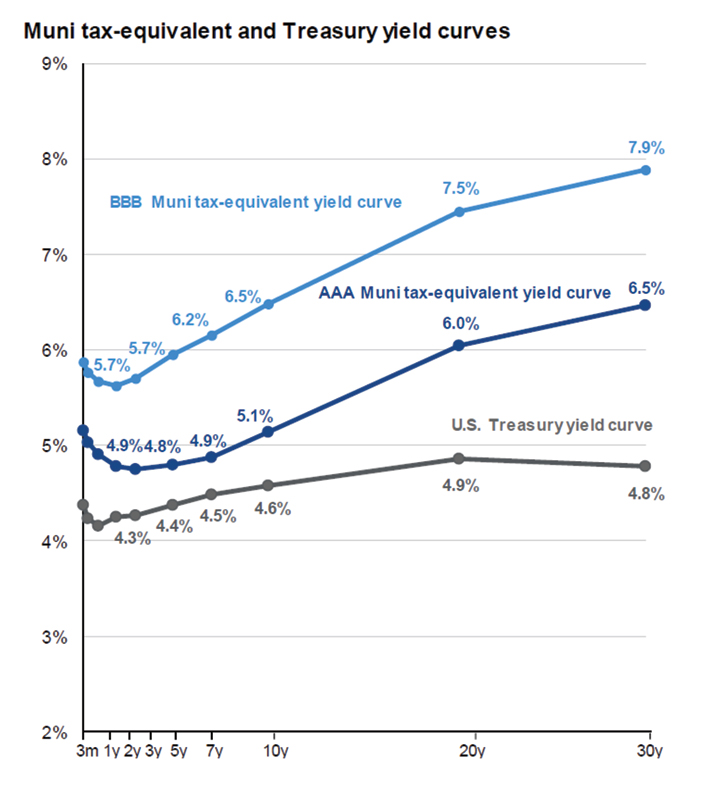
Source: J.P. Morgan Asset Management. Municipal tax-equivalent yields are calculated based on municipal bond curves for each credit rating according to S&P Global and assume a top-income tax bracket of 40.8%.
Municipal bonds continue to be a compelling opportunity for high income earners, especially given the significant rise in rates over the last couple years. Oversized high grade municipal supply did lead to some underperformance in 2024 relative to U.S. Treasuries and corporate bonds but still offer attractive entry points and spreads when compared.
We continue to recommend clients utilize municipals to capture tax advantaged yields, through separately managed accounts and funds that balance a mix of investment grade and high yield bonds to provide strong income.
What to expect in the third year of the bull market

The cost of timing the market can be steep

2025 earnings expectations show positive trends

Equity returns following rate cuts depend on the economic environment

Large cap earnings continue to outpace mid and small…

…while we recommend staying diversified across market cap and balanced between growth and value

Quality keeps pace and offers attractive outlook
The quality factor in investing refers to the tendency of high-quality stocks with typically more stable earnings, stronger balance sheets and higher margins to outperform low-quality stocks, over a long-time horizon. Research has shown that quality companies, those with higher ROE, lower leverage, and more sustainable cashflows and earnings, outperform lower quality companies over time. Quality stocks are poised to keep pace with broad market stocks, as seen in 2024, while offering insulation from potential economic downturns given strong company fundamentals.

U.S. vs International – cheap doesn’t always mean good
While International stocks are at historic lows in terms of P/E discounts when compared to U.S. stocks, that does not always mean they represent a better return outlook.

The US is expected to continue growing faster than the Eurozone…

…but the gap in earnings growth is expected to narrow

Growing crisis of confidence in Chinese growth
Without more significant reform steps, expect to hear more about the “Japanification” of China .
Alternatives boast strong diversifiers to public markets

Manager selection remains key in private markets while margin shrinks in public areas.
2023 and 2024 continued to show the trend that active management in public markets is quite difficult to outperform indexes, while private markets exhibit the importance of finding best in class managers.
The return dispersion, as illustrated below, between the top and bottom quartile private fund managers over the last 10-years is vastly larger versus public markets. Given the illiquid nature, lack of public information, and longer time horizon, private markets require strict and comprehensive due diligence to select best in class managers for investments.

Looking ahead in alternatives

With BTC… a little can go a long way
2024 saw historical returns for Bitcoin as the price finally reached the $100,000 milestone and boasted an annual total return of 123%+. Many have speculated as to how to size a potential Bitcoin allocation, but historical risks show even a small allocation can have an outsized portfolio impact.
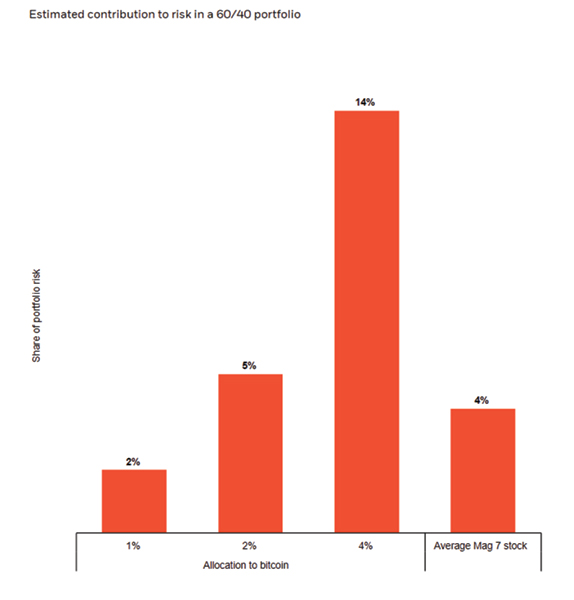
Source: BlackRock Investment Institute with data from Bloomberg, December 2024. Notes: The chart shows bitcoin’s share of portfolio risk in a hypothetical 60-40 stock-bond portfolio at different allocations based on risk contribution. It also shows what share “magnificent 7” stocks (Alphabet, Amazon, Apple, Meta, Microsoft, Nvidia and Tesla) add to overall risk on average based on their current index weights. Indexes used: Bloomberg Developed Markets Large and Mid Cap for equities and the Bloomberg Global Aggregate for bonds. Risk contribution is estimated using weekly returns between May 2012 and July 2024.
After strong years, investors should evaluate rebalancing to targets
Excluding 2022, markets have been on an up and to the right trajectory with little standing in their way. Led by US equities, and more specifically Technology stocks, the typical investor 60/40 allocation has become out of balance. As investors weigh decisions around realizing gains, it is prudent to point out the new allocation weights versus their targets and determine if rebalancing is necessary.

Macro Overview
The macroeconomic setup for 2025
At the start of 2024, the pace and scope of the Fed’s interest rate cutting cycle was the financial market’s main concern. Despite fears that the Fed’s aggressive hiking cycle would prove to be a policy mistake, U.S. growth continually surprised to the upside. Inflation trends largely cooperated as well, as did corporate earnings – especially the Magnificent 7. Widespread excitement over the visible advances in AI also renewed investor enthusiasm and kicked off a huge technology capex expansion.
2025 brings with it more of the same in terms of the economic outlook: US growth stronger than overseas, profits set to grow, and growing federal budget deficits. The seeming permanence of the high deficit, combined with President-elect Trump’s renewed tariff threats and recent Fed guidance, have led many to believe the rate cutting cycle will be shallow.
While still in a clear downtrend, recent inflation data has disappointed, in part due to unionized workers’ gains belatedly catching up. Another factor has been the lagged impact of rental price increases abating. We are watching the bond market for further signs of indigestion, especially as tariff and tax policy negotiations come to the fore.
Overseas growth generally remains weak, especially in the former driver of demand, China. So far the government’s efforts to navigate their housing bust have been an example of “muddle through.” as with last year, relative economic bright spots include India and Japan.
What’s driving US economic growth?

Never underestimate the US consumer
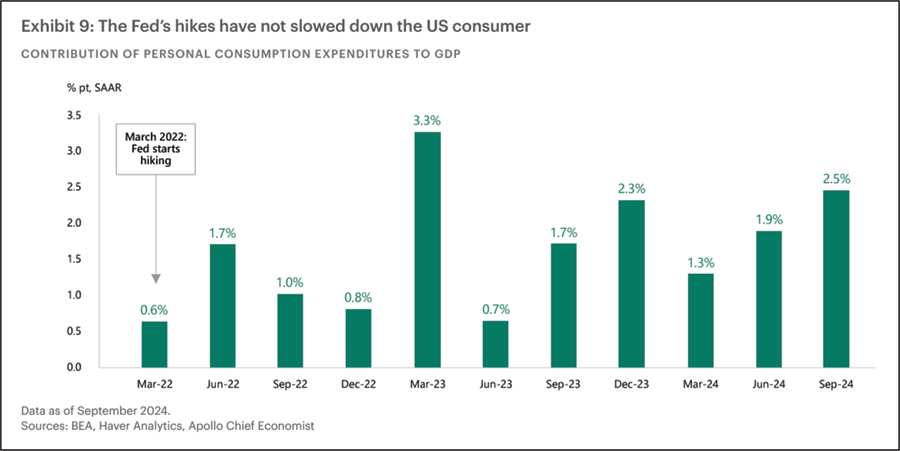
Led by the consumer and technology capex, the economy has been less sensitive to the Fed raising rates in this cycle. Fiscal policy continues to be stimulative, so we expect the largely-domestic US economy to continue on a growth path.
The Fed’s predictions have been dead wrong…
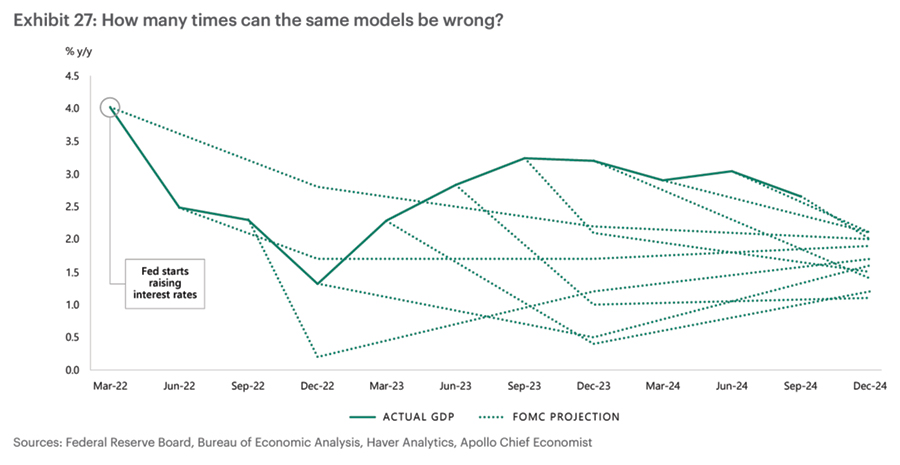
Throughout the last two years the Fed expected growth levels much lower than were actually realized.
…and the market’s forecasts for rate cuts haven’t been any better

Comparing the economy in 2016 vs. the end of 2024

US economic heatmap

Is Inflation in a new norm?
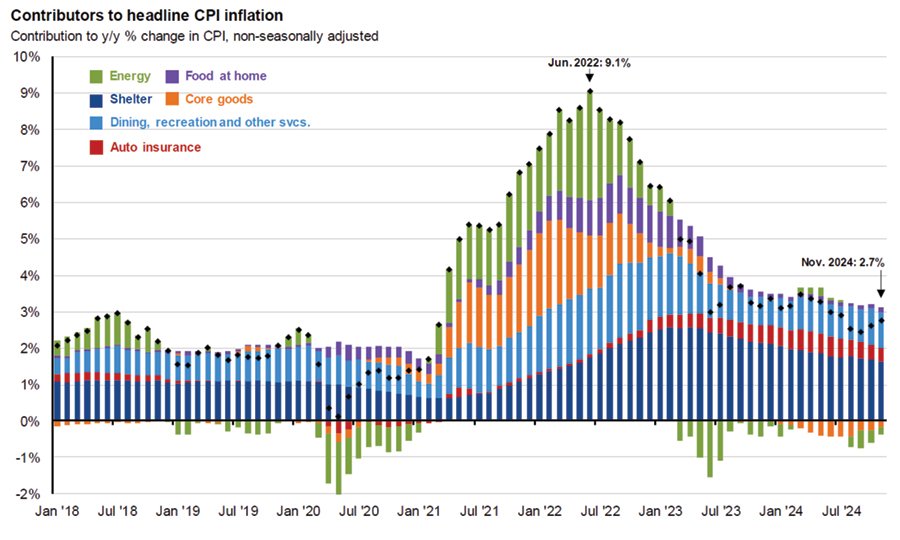
Source: BLS, FactSet, J.P. Morgan Asset Management
Looking deeper under the hood, core inflation has continued to decline after peaking in Q3 2022. The headline disinflation has been driven by reversals in energy costs since 2022 and significant slowing in vehicle prices and shelter costs. While housing transactions slowed during 2023 and into 2024 due to high mortgage rates, rents have been rising 2-3%, versus double digits during the Pandemic.
Inflation Progress
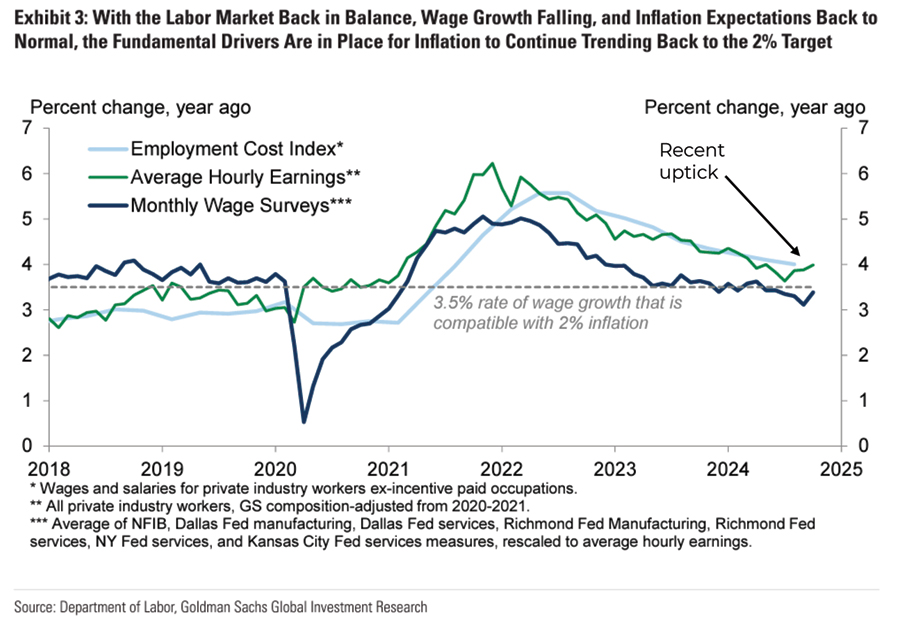
Debate over recent “kink”: temporary or not?
Market-derived inflation expectations
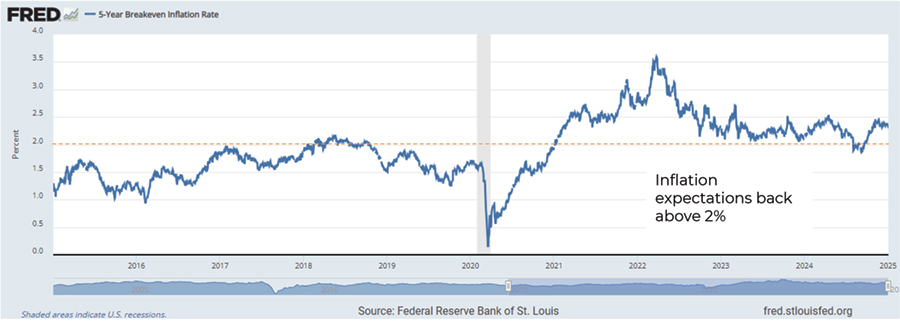
In addition to the actual inflation data, markets expectations are a critical input for Fed policy. Using the 5-year inflation breakeven rate, we can see that expectations for future inflation have ticked upwards in the second half of 2024, giving some caution to the Fed policy.
The US: fading hopes for numerous interest rate cuts
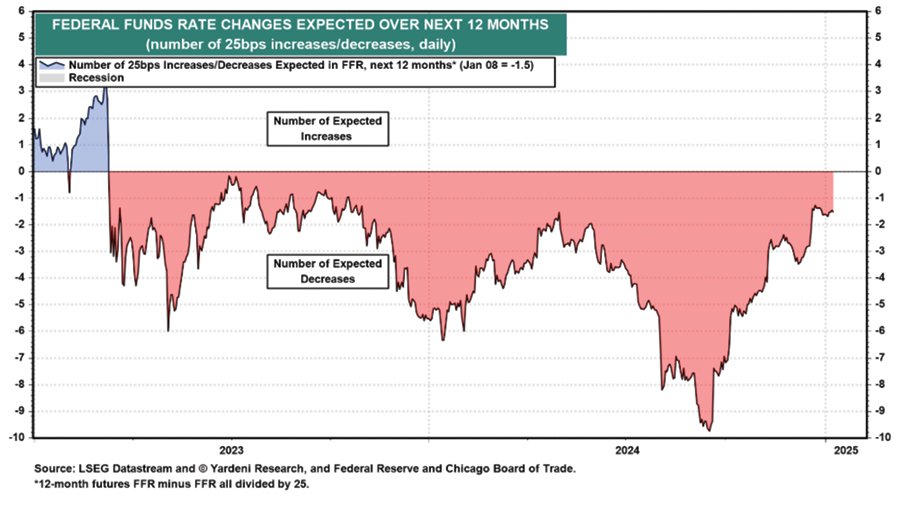
Stubborn consumer inflation at the end of 2024 prompted observers to reduce their expectations for interest rate cuts.
Current market expectations for rates at year end
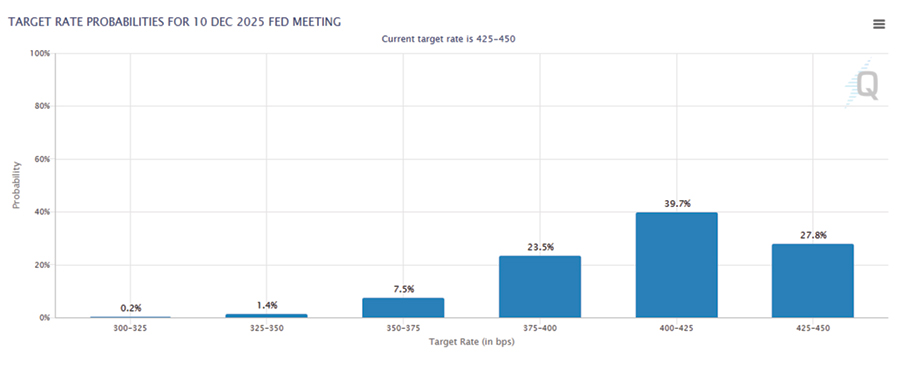
Source: CME FedWatch; data as of January 14, 2025
At present, the market expects the Fed will be largely done cutting rates at about the 3.5-3.75% level.
Higher interest rates and input costs holding back
housing starts

Leverage: business and consumers in good shape,
government debt levels high

The federal budget deficit is high…
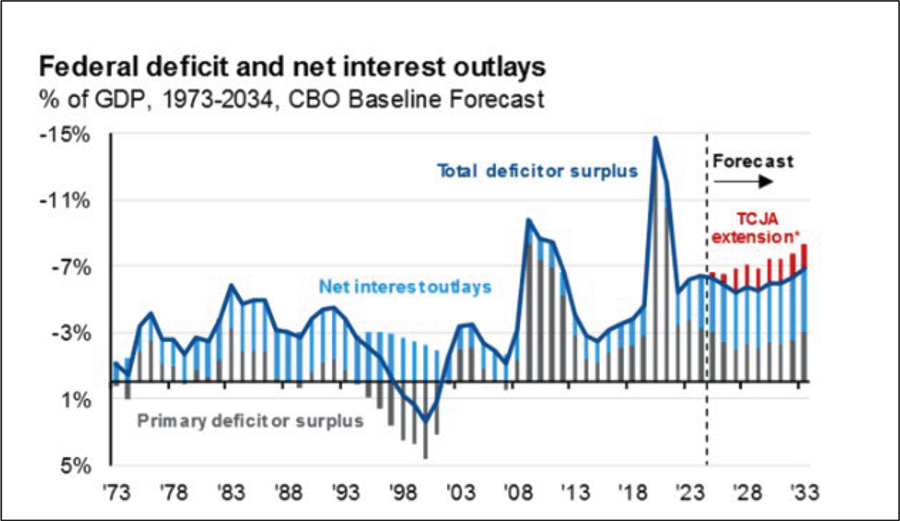
Source: J.P. Morgan
At present, the U.S. faces a primary deficit, higher interest rate payments on the debt than usual, and a likely shortfall from renewing the Trump TCJA tax cuts.
…but we do not believe it will become unsustainable in the near term

Financial Planning
Retirement, Estate and Gift Tax Planning for 2025
The current Tax Cuts and Jobs Act (Trump tax cuts) is still in effect for 2025, along with the provisions from Secure Act 1.0, Secure Act 2.0, and the Inflation Reduction Act (IRA) that were passed during the Biden administration.
There will certainly be changes in 2026, but some of the notable and actionable items for 2025 include:
- The Lifetime Exemption for Estate, Gift and GST taxes has moved up to $13,990,000 per The Annual Exclusion has also crept up to $19,000. The rate remains 40%. Consider “topping off” Trusts early in 2025.
- While the IRA maximum contribution remains at $7k per person ($8k if 50+), 401(k) type plans have moved up to $23,500 plus another $7,500 Catch-up for those 50 and A brand-new feature for 2025 is an $11,250 Catch-up amount for those aged 60-63. This is in place of the regular $7,500 Catch-up amount during those years, not an additional Catch-up. At age 64 it reverts to the regular amount.
- All individuals and businesses affected by Hurricane Helene, including the entire states of AL, GA, NC and SC, along with parts (check FEMA website) of FL, TN and VA are entitled to filing and payment postponement until May 1, This includes any 2024 individual or business tax return normally due during March or April of 2025; IRA and HSA contributions normally due 4/15/25; 4th Qtr Estimated Tax Payments for 2024 normally due on 1/15/25 and 1stQtr Estimated Tax Payments for 2025 normally due on 4/15/25; and 663(b) elections and distributions from a Trust normally due on 3/6/25.
- The maximum Qualified Charitable Distribution (QCD) amount for 2025 increases to $108k per spouse. QCD’s should be utilized first before taking out any RMD’s for personal use since an RMD cannot be recharacterized to a QCD later.
- RMD beginning ages based on birthdate:
Before 7/1/49 70.5 7/1/49 – 12/31/50 72 1/1/51 – 12/31/59 73 1/1/60 and After 75
Income, Estate and Gift Tax Planning Beyond 2025
As a result of the recent election, Republicans have secured control of Congress and the White House. They will likely use the current Tax Cuts and Jobs Act (TCJA), which sunsets on 1/1/26, as a baseline/starting point for any new tax legislation going forward. They will potentially have two bites at the Budget Reconciliation apple to accomplish this. The Senate would prefer to focus on border security, energy, and defense right away with the first BR, and tackle tax policy later in the year with a second BR. The House wants to combine both issues into one BR, which they would begin working on immediately. So far, Trump has not officially weighed in on the matter. Since most of the major tax laws should remain largely intact, there is less incentive for Sage Mountain clients to finalize any big planning moves during 2025. A wait-and-see approach may work best until we learn more. Some potential changes or tweaks to the tax law could include the following:
- Increasing the $10k per household SALT limitation to at least $20k for joint filers or possibly more. It’s doubtful it will be completely eliminated, as the cap brings in a large amount of tax revenue. A substantial increase could be paired with a decrease in the AMT exemption, which is currently very high. The result would be a taxpayer being able to write off more SALT but have greater AMT exposure.
- There is bipartisan consensus for increasing the current child tax credit above the current $2k per child limit. The current $400k AGI phase-out could be lowered to compensate for the lost tax revenue.
- Trump wants to further lower the Corporate tax rate below the current 21%. If that happens, there would be a corresponding increase in the QBI deduction to maintain parity for pass-through entities.
- Reduce or eliminate credits for EV’s and other green energy credits previously passed as part of the IRA.
- The Estate Tax Lifetime Exemption is likely to remain at or around the current ~$14mm per person instead of being cut in half to ~$7mm. This reduces the need for couples in the $14mm – $28mm range to gift assets out of their estate before 1/1/26. It may potentially be better for them to keep those assets inside their estate and let their heirs receive a step-up in basis at death.
- Finally, the duration of the new round of tax cuts will be crucial. The original TCJA lasted for eight years (2018-2025). Reducing this round to four years might make it more palatable to fiscally conservative deficit hawks who might otherwise balk at the price-tag.
Disclosures
Past performance is not indicative of future results. Sage Mountain Advisors, LLC (“SMA”) is an independent SEC registered investment advisor. Any reference to or use of the terms “registered investment adviser” or “registered,” does not imply that SMA or any person associated with SMA has achieved a certain level of skill or training. This material is provided for informational and educational purposes only.
Any subsequent, direct communication by SMA with a prospective client shall be conducted by a representative that is either registered or qualifies for an exemption or exclusion from registration in the state where the prospective client resides. For more information pertaining to the registration status of SMA, please contact SMA or refer to the Investment Adviser Public Disclosure website (www.adviserinfo.sec.gov). The information contained herein should not be construed as personalized investment, tax, or legal advice. Certain information contained in this presentation has been derived from third party sources. While we believe these sources to be reliable, we make no representations as to the accuracy, timeliness, and completeness of any such information prepared by any unaffiliated third party incorporated herein, and take no responsibility therefore. As such, there is no guarantee that the views and opinions expressed in this presentation will come to pass.
All investments carry a certain degree of risk of loss, and there is no assurance that an investment will provide positive performance over any period of time. The statements contained herein reflect opinions, estimates and projections of SMA as of the date hereof, and are subject to change without notice. SMA reserves the right to modify its current investment strategies and techniques based on changing market dynamics or individual portfolio needs. The opinions expressed herein are those of SMA and are subject to change without notice. Information presented should not be considered as a solicitation or recommendation to buy or sell any security, financial product, or instrument discussed herein. Additionally, this material contains certain forward-looking statements which point to future possibilities. Due to known and unknown risks, other uncertainties and factors, actual results may differ materially from the results portrayed or implied in such forward-looking statements. Furthermore, the illustrative results presented in this presentation in no way reflect the performance of any SMA product or any account of any SMA client, which may vary materially from the results portrayed for various reasons, including but not limited to, investment objectives, financial situations and financial needs of SMA clients; differences in products and investment strategies offered by SMA; and other factors relevant to the management of SMA client accounts.
This presentation and its contents are provided “as is” without warranty of any kind, express or implied, including, but not limited to, implied warranties of merchantability, fitness for a particular purpose, title, non-infringement, security, or accuracy. SMA reserves the right to modify its current investment strategies and techniques based on changing market dynamics or client needs. It should not be assumed that any of the security transactions, holdings or sectors discussed were or will prove to be profitable, or that the investment recommendations or decisions we make in the future will be profitable or will equal the investment performance of the securities discussed herein. Actual investment advisory fees incurred by clients may vary. A complete description of SMA’s fee schedule can be found in Part 2 of its FORM-ADV which is available at www.sagemountainadvisors.com or by calling (404) 795-4861. Clients are advised that no portion of the services provided by SMA should be interpreted as legal, tax or accounting advice. For legal and tax-related matters, we recommend that you seek the advice of a qualified attorney, accountant or tax professional. SMA-24-0172