SAGE MOUNTAIN 945 East Paces Ferry Rd NE, Suite 2660, Atlanta, GA 30326
Sage Mountain Research
Market Update – Q1 2023
2023 began as a tale of two quarters, as a promising start was met with struggling economic data and looming recession outlooks.
Pushing further on their tightening path, the Federal Reserve hiked rates two more times in the first quarter. The March Fed Funds rate stood at 4.75% – 5.00%, evidence of the Fed’s aggressiveness in their attempt to restrain inflation. In response to the collapse of Silicon Valley bank and fears of deposit flight at other regional banks, the Fed changed their tone at the March meeting, signalling the end of the rate hike campaign is in sight.
Current expectations are for an additional 25 bps hike, although it could potentially be their last as inflation has come down from its peak of 8.9% y/y in June 2022 to 5.0% y/y in March 2023.
The first quarter saw large divergence in asset class returns. Broad equities and fixed income classes rebounded sharply but with heightened volatility. The Bloomberg US Aggregate Bond Index returned 3.0% while the S&P 500 posted a strong 7.5% quarter, led by growth-oriented sectors.
Commodities were one of the few dark spots, returning -4.9% as energy struggled amid global macro concerns and continued Russian production.
Maintaining our shorter duration position in fixed income and diversification into alternative asset classes added value to begin the year. US and international equities performed similarly, with international just ahead as the US Dollar weakened from a high level. We continue to maintain our views on US vs. international positioning, while watching closely for catalysts of change in asset classes to provide opportunity and rationale for reallocations.
As a result of the 2022 decline, equity and bond prices are more attractive. Fixed income investors can finally get some yield for taking interest rate and credit risk, as spreads over Treasuries have widened from the unusually low levels seen in 2021. From here, areas to monitor include the development of a credit crunch if banks pull back on lending and how that could impact the commercial real estate market. We seek to be mindful of potential risks while also being careful to avoid any rash investment decisions. History shows that trying to predict market tops and bottoms is impossible, but it also shows that maintaining adherence to a tailored asset allocation increases one’s chances to achieve their financial goals.

Fixed income began the year negatively as Fed rate hikes continued, but signs the cycle would soon end restored some optimsim.
Equities had a first quarter full of twists and turns but ended up sharply as technology and growth-oriented sectors led.
Alternative assets like private equity and real estate continue to generate similar returns to public markets but with less daily volatility.
The US Dollar declined roughly 1.0% in the first quarter, continuing the negative trend from Q4 2022.
A 60% equity / 40% bond portfolio performed well in Q1, posting a 5.7% return fueled by equities. This was a sigh of relief following one of its worst years in 2022, down 16.1%.
Illustrative current positioning and asset class views
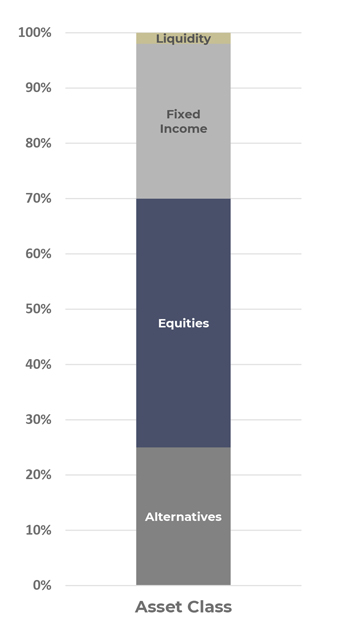 Liquidity
- One benefit of the rise in interest rates is higher yields on cash. With yields on money market funds near 4.50% or higher, we strategically utilize those high yielding cash instruments to earn income while ensuring we meet clients’ liquidity needs.
Fixed Income
- 2023 continued the historic rate hike from the Federal Reserve, seeing two more 25 bps hikes at the January and February meetings.
- In a reversal from 2022, longer duration bonds outperformed shorter duration counterparts as the middle to long end of the curve fell on the back of global growth concerns.
- We remain overweight shorter duration on the curve, which was beneficial in 2022 as longer-term bonds sold off on fears of continual higher rates. In Q4 this began to reverse. Given the higher starting yields and elevated recession risk, we will consider selectively adding duration as a hedge against equity downside.
Equities
- Equity markets posted strong gains in the first quarter, a stark reversal from 2022 as US and international markets reacted positively to rates, a theme that should continue as earnings expectations come in line.
- Returns were driven by large cap, growth focused companies that were propelled by an increase in valuations as longer-term interest rates declined in Q1.
- We continue to overweight US equity markets vs international (4:1 allocation) and focus on Quality as a factor tilt. Quality was one of the top performing factors during the 1Q, returning 9.2%, while our overweight to the US was a slight detractor as USD weakness pushed international stocks just ahead of US returns.
Alternatives
- Alternatives remain a predominant asset class within our portfolios to diversify risk and drive capital growth and income.
- Private real estate was one of the best performing asset classes in 2022, however we are closely watching the amount of commercial real estate debt coming due in the next 24 months. Especially given the fallout of regional banks and how asset and balance sheet concentration can lead to stress and potential failures.
- Given the recent downturn, we believe diversified venture capital funds with fresh capital will be
able to invest at attractive valuations. Secondaries funds across assets classes are also well-positioned to take advantage of stressed markets. Alternative lenders may also benefit if banks retreat.
Expected short term interest rates have decreased significantly after increasing earlier this year

The chart shows market-implied yields for 3-month Eurodollar futures, a proxy for the Fed Funds Rate. After increasing between year end and early March due to accelerating US growth and stubbornly high inflation, yields are now expected to peak at a lower rate in Q2 and decline in the second half of the year.
Markets are now pricing a peak rate of 5.3% in June, implying one additional Fed rate hike of 0.25%.
That is a meaningful decrease vs. the expected peak of 5.9% as of March 7— immediately prior to the emergence of the concerns with regional banks. Short term rates are now expected to end the year at 4.6% vs. 5.8% as of March 7 and 4.7% as of December 31.
Inflation is on the right path, slowly…

After 2021-2022 saw continued stress on consumers and businesses from hot inflation, a sustained downtrend is underway.
There are key differences in 2023 relative to the rising and sustained inflation experience in 2021 and 2022:
- Headline inflation has fallen from a peak of 8.9% in June 2022 to 5.0% in March 2023, while core inflation has dropped to 5.6% from a peak of 6.7%.
- After Russia’s invasion, energy prices have been declining since late summer of 2022.
- Recovering supply chains and lower demand from consumers have cooled inflation across core goods.
Banking Crisis Update
A Brief Recap of the Issue: Bonds and mortgage securities owned by a few banks with atypical business models were badly impacted by rising rates. This in turn spooked depositors, many of whom were in the close- knit venture capital community. The subsequent bank run led to the banks’ collapse and the emergency FDIC/Federal Reserve intervention. Analysts feared contagion would spread to all but the largest banks, who are (rightly) considered too big to fail and who must hold more capital on their balance sheets.
What data we have paints a picture of an initial flight which has since moderated, leaving smaller banks impacted but not crippled. Notably, we haven’t seen another midsize or large bank fail in recent weeks. Lending from the Fed’s discount window and Bank Term Funding Program has also slowed. However, banks still face the significant problem of depositors either losing confidence or leaving for higher rates (money markets, CDs at other institutions) unless the banks raise their deposit rates, which could hamper profitability.
Thus, the issues are:
- Slower but potentially continuing deposit erosion at banks.
- Declining bank profitability.
- Uncertainty over new capital requirements at the banks.
- Banks significantly tightening lending to shore up capital and liquidity.

The combination of these could result in a sharper slowdown than expected. Various estimates have been suggested, with the Fed saying the impact could be equivalent to a 25-50 basis point rate hike. Others expect a more significant impact. For example, Torsten Slok, the chief economist at investment manager Apollo, estimated that the recent disruptions have produced tightening equivalent to the Fed raising interest rates 150 basis points.
At this point, we just don’t know how large the impact will be, but it is looking more manageable than feared. The market assumes if the problem intensifies, the authorities will act to expand deposit coverage. If the Fed indeed cuts rates in 2024, this could help boost the value of the assets the banks own while reducing the pressure to raise deposit rates, further easing the problem.
Banking and Commercial Real Estate (CRE)
Because small and midsize banks are major lenders to the CRE space, the banking crisis has accelerated concerns about the commercial property market’s ability to refinance existing debt. Retail (rise of internet shopping) and office (work from home, recession worries) have already faced significant concerns, but now there is a more generalized fear. While these narratives are not new, real estate can take some time to manifest problems and, in turn, to resolve them. Apart from retail and office, major sectors such as multifamily, medical office and industrial appear to have healthy cash flows and, thus, have good long-term prospects. Some investments made at too-aggressive valuations could suffer, but we remain generally optimistic about real estate investments for clients.
While debt maturities have been an elevated concern for CRE, publicly traded office REITs do not face significant near-term debt maturities; the peak remains relatively far off in 2026 and 2027. With current weighted average coupon rates at or below 4% across maturities, however, they could face significantly higher interest costs if they refinance. In the multifamily space, we believe that credit will continue to be available, although at higher rates.
Our response to these issues is to continue looking for solid risk adjusted rewards outside the riskier spaces. The chart below from FactSet makes two points. One is that the problems in the office sector are likely to be slow moving, which hopefully will limit knock on effects. Sage Mountain has minimal exposure to office. Second, the table at right shows that valuations have already improved for many real estate income investments.
")
Stock Market Valuation and Earnings Forecast
Between uncertainty over inflation, the Fed’s response, and the impact of troubles in the banking sector, the earnings outlook is unusually uncertain. Analysts typically begin the year with an overly optimistic earnings outlook, and cut their estimates as the year goes on. Goldman estimates the average cut to S&P 500 earnings estimates is 7%, and forecasts have already been cut by 12% since June 2022 and 4% year to date. We interpret this as a signal that we are now past most of the deterioration in earnings estimates for 2023, however expectations change constantly in reaction to a variety of macro factors.
Of course, earnings are only half of the story with valuations. According to data from JPMorgan, the S&P 500 currently trades at forward P/E ratio of 18.3x vs. the 25-year average of 16.8x. Using the current consensus earnings forecast for 2024 of $247, the S&P 500 would end the year at 4,150 based on that average P/E ratio or 4,500 using the current valuation. That range implies returns of about 1.5% to 10% over the remainder of the year.
Interest rates also play a role, with lower interest rates typically resulting in higher stock market multiples. We believe the equity market is fairly valued for the current outlook for earnings, margins, and interest rates. To make a case for stronger earnings, either GDP must be stronger than expectations, or companies will have to protect margins unusually well. This is one of the reasons we continue to look for returns in the alternative space.


Correlations are shifting, what does this mean for your portfolio?
Correlation measures the degree to which two variables move in relation to each other. Correlation provides diversification benefits when you own two assets that move in unrelated or in opposite directions. Classically, stocks and government bonds often behave this way, although that certainly not the case in 2022.
For the past two decades or so, returns from equities and bonds have exhibited negative correlation, providing diversification benefits to multi-asset investors through reduced volatility and drawdown protection. However, the current macroeconomic conditions have brought to question whether the trend is shifting. Over the past three years, the correlation between traditional asset classes (public equities and bonds) have risen and remained at high positive levels as we have seen 1.) higher interest rate volatility and 2.) inflation. When these factors remain high and volatile, and monetary policy has failed to smooth them out, we expect to see positive equity-bond correlations.
As inflation has risen to multi-decade highs and its outlook is arguably also highly uncertain, this could lead to more rate volatility as central banks withdraw stimulus to cool the economy. This highlights the importance and advantages of using alternative asset classes within portfolios to further diversify risk, while also potentially increasing returns to help achieve individual goals.

Source: KKR. Data from 3/31/2020 through 12/30/2022
Private Equity refers to Cambridge Associates Benchmark, Private Credit refers to the Cliffwater Direct Lending Index, Real Estate Equity refers to Green Street US Commercial Real Estate, Real Estate Credit refers to Giliberto-Levy Commercial Mortgage Index, and Private Infrastructure refers to Cambridge Associates Benchmark.
Disclosures
Past performance is not indicative of future results. Sage Mountain Advisors, LLC (“SMA”) is an independent SEC-registered investment advisor. Any reference to or use of the terms “registered investment adviser” or “registered,” does not imply that SMA or any person associated with SMA has achieved a certain level of skill or training. This material is provided for informational and educational purposes only.
Any subsequent, direct communication by SMA with a prospective client shall be conducted by a representative that is either registered or qualifies for an exemption or exclusion from registration in the state where the prospective client resides. For more information pertaining to the registration status of SMA, please contact SMA or refer to the Investment Adviser Public Disclosure website (www.adviserinfo.sec.gov). The information contained herein should not be construed as personalized investment, tax, or legal advice. Certain information contained in this presentation has been derived from third-party sources. While we believe these sources to be reliable, we make no representations as to the accuracy, timeliness, and completeness of any such information prepared by any unaffiliated third party incorporated herein, and take no responsibility therefore. As such, there is no guarantee that the views and opinions expressed in this presentation will come to pass.
All investments carry a certain degree of risk of loss, and there is no assurance that an investment will provide positive performance over any period of time. The statements contained herein reflect opinions, estimates, and projections of SMA as of the date hereof, and are subject to change without notice. SMA reserves the right to modify its
current investment strategies and techniques based on changing market dynamics or individual portfolio needs. The opinions expressed herein are those of SMA and are subject to change without notice. Information presented should not be considered as a solicitation or recommendation to buy or sell any security, financial product, or instrument discussed herein. Additionally, this material contains certain forward-looking statements which point to future possibilities. Due to known and unknown risks, other uncertainties, and factors, actual results may differ materially from the results portrayed or implied in such forward-looking statements. Furthermore, the illustrative results presented in this presentation in no way reflect the performance of any SMA product or any account of any SMA client, which may vary materially from the results portrayed for various reasons, including but not limited to, investment objectives, financial situations and financial needs of SMA clients; differences in products and investment strategies offered by SMA; and other factors relevant to the management of SMA client accounts.
This presentation and its contents are provided “as is” without warranty of any kind, express or implied, including, but not limited to, implied warranties of merchantability, fitness for a particular purpose, title, non-infringement, security, or accuracy. SMA reserves the right to modify its current investment strategies and techniques based on changing market dynamics or client needs. It should not be assumed that any of the security transactions, holdings, or sectors discussed were or will prove to be profitable, or that the investment recommendations or decisions we make in the future will be profitable or will equal the investment performance of the securities discussed herein.
Actual investment advisory fees incurred by clients may vary. A complete description of SMA’s fee schedule can be found in Part 2 of its FORM-ADV which is available at www.sagemountainadvisors.com or by calling (404) 795-4861. Clients are advised that no portion of the services provided by SMA should be interpreted as legal, tax or accounting advice. For legal and tax-related matters, we recommend that you seek the advice of a qualified attorney, accountant, or tax professional. SMA-22-000470