SAGE MOUNTAIN 945 East Paces Ferry Rd NE, Suite 2660, Atlanta, GA 30326
Sage Mountain Research
Q1 2025 Market Update
Q1 recap: markets reverse trend, recession fears increase, and uncertainty rises.
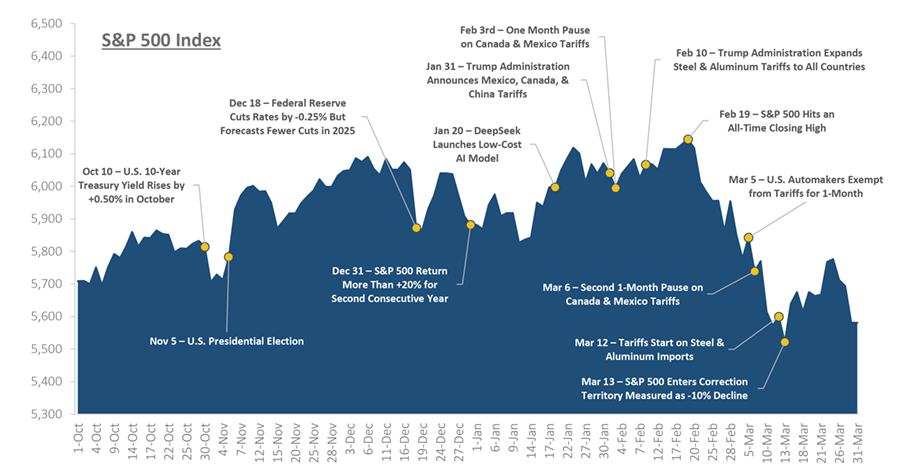
The start of 2025 looked promising for the stock market, continuing the strong performance we’ve seen over the past two years. The S&P 500 reached its highest point ever in mid-February, the economy was showing positive signs, and investors were feeling optimistic.
However, the mood changed in late February when President Trump’s administration began implementing new policies. After two straight years of excellent returns (over 20% gains each year), the S&P 500 ended this quarter with a decline -4.3%. The new administration has focused on changing trade policies, introducing tariffs, and reducing government spending. These changes represent a significant shift from previous policies and have caught the attention of investors and business leaders globally.
The majority of the stock market’s decline happened in the second half of the quarter, after reaching that record high on February 19th. A small number of mega cap companies led the downturn. Technology stocks were hit particularly hard: growth stocks fell by -10.0%, while the Nasdaq 100 dropped by -8.1%.
The recent market decline tells an interesting story when we look at different parts of the market.
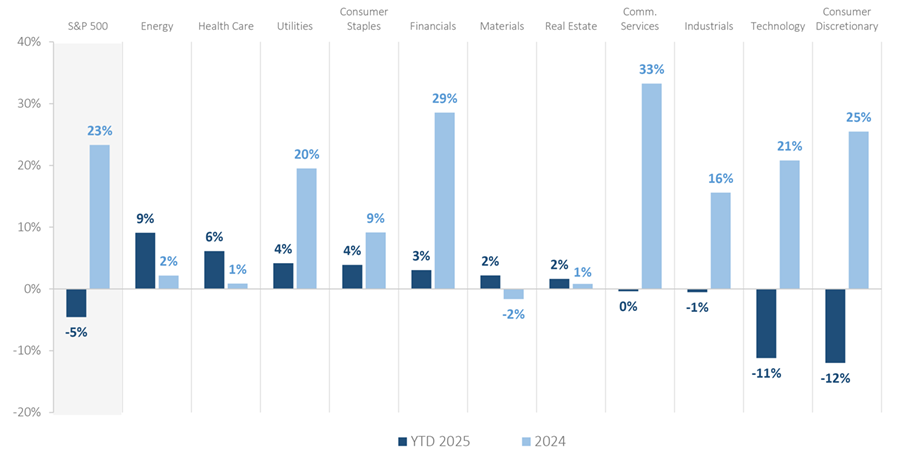
Nine out of eleven sectors in the S&P 500 did better than the overall market in the first quarter. Seven of these sectors even showed positive returns, while two remained flat. This is quite different from last year, when only a few sectors drove the market’s strong performance.
International investments performed better than U.S. stocks during the quarter, one of the biggest differences we’ve seen since 2000. This happened partly because those large U.S. technology companies that struggled brought down the overall market performance. European markets did particularly well as their governments announced plans to increase spending, which encouraged investors to move money from U.S. stocks to European ones in hopes of stronger growth there. Emerging markets lagged developed international markets but still outperformed the U.S.
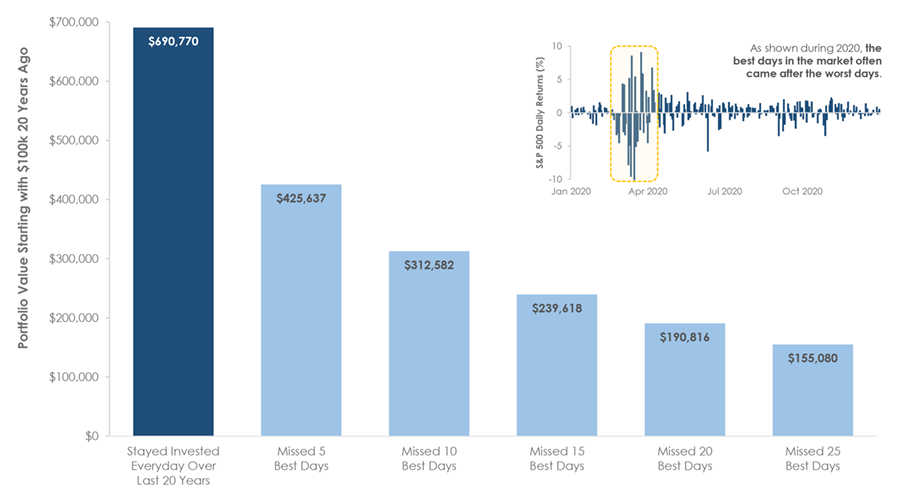
It is important to remember that the performance of the stock market generally doesn’t reflect real-time economic conditions. The market is forward-looking and prices in expectations for what’s to come. Historically equities bottom several months before improvements in earnings, GDP, and payrolls. If an investor tries to sit on the sidelines until it feels like the worst is behind us, they will likely miss a significant part of the eventual recovery.
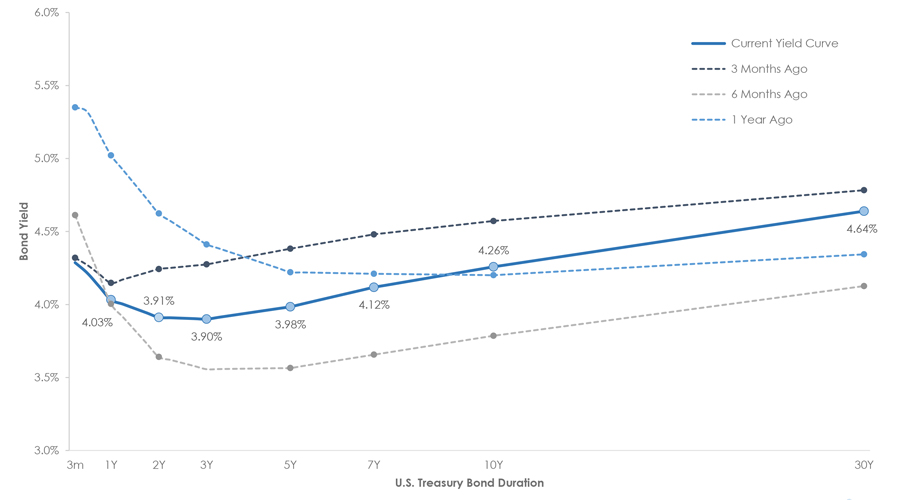
There were two notable themes in the bond market in Q1: falling U.S. Treasury bond yields and wider credit spreads. The 10-year Treasury yield fell from a peak of around 4.80% in mid-January to 4.15% in early March. It was a reversal from Q4, when the 10- year yield rose more than +0.75% due to renewed inflation concerns. Several factors contributed to the Q1 reversal, including rising policy uncertainty, the potential for tariffs, and concerns about slower economic growth. The combination prompted investors to move money into longer-maturity government bonds, which are viewed as safe havens. Bond prices rise as yields decline, and Treasury bonds provided diversification benefits in Q1, offsetting a portion of the stock market decline.
Another major theme was credit spread expansion. Credit spreads measure the difference in yield between bonds with credit risk and U.S. Treasuries which are (correctly, in our opinion) considered to have zero default risk. Spread levels can serve as a real-time gauge of market sentiment, showing how easy or expensive it is for companies to borrow money. A narrower spread signals that investors view credit risk as low, while a wider spread signals higher perceived default risk.
The high-yield spread narrowed in late 2024 as the Federal Reserve cut interest rates, reaching levels last seen in 2007. However, credit spreads did widen in Q1. The increase indicates investors are becoming more cautious, with the potential for tariffs and slower economic growth leading to higher credit risk.
Despite the recent rise, credit spreads remain low by historical standards. Compared to past periods of market stress, today’s spread levels suggest financial conditions are still relatively stable, a reflection of the U.S. economy’s overall strength. While investors are concerned about policy uncertainty and the potential for slower growth, the market is not signaling financial distress. However, if spreads continue to widen, it could signal tighter financial conditions and raise concerns about potential defaults. The market will be watching spreads closely.
Market Snapshot
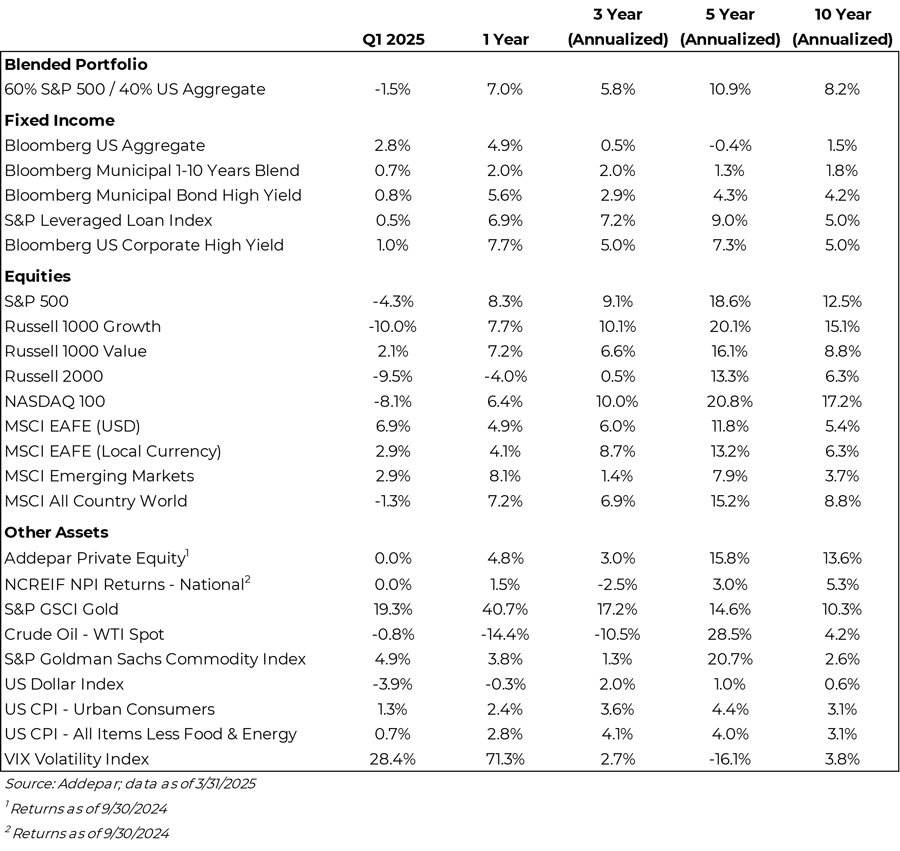
Investment grade fixed income saw positive gains in Q1, as equity markets were rattled and investors flocked to bonds.
With continued volatility, the S&P 500 reversed from much of 2024 with a -4.3% return in Q1, fueled by a tech and growth sell-off.
In a trend reversal, equity markets were led by International stocks as the USD fell and US markets traded down. Additionally, within the US, value stocks held strong and sharply outperformed growth.
A 60% equity / 40% bond portfolio fell -1.5% in Q1 but is up +7.0% for the last 12- months driven by positive fixed income and equity returns.
Market Recap – Key Headlines From the Past Six Months
Disclosures: Standard & Poor’s. The performance of this index is provided for informational purposes only and does not represent an actual investment. Index performance is for illustrative purposes only and does not reflect any management fees, transaction costs or expenses. Indexes are unmanaged and one cannot invest directly in an index. Past performance does not guarantee future results.. Latest available data as of 3/31/2025.
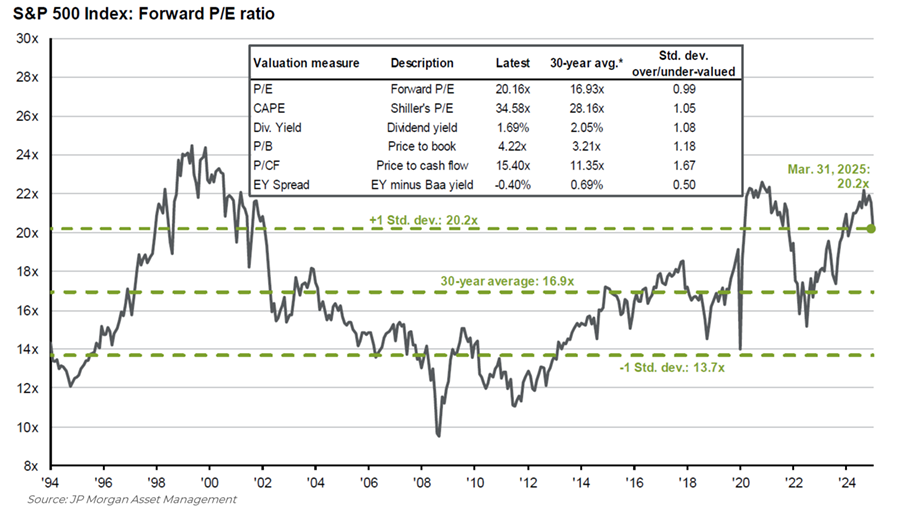
Valuations fell on the back of tariff fears, but are still above long-term averages
Price-to-earnings is price divided by consensus analyst estimates of earnings per share for the next 12 months as provided by IBES since March 1994 and by FactSet since January 2022. Average P/E and standard deviations are calculated using 30 years of history. Shiller’s P/E uses trailing 10-years of inflation-adjusted earnings as reported by companies. Dividend yield is calculated as the next 12-months consensus dividend divided by most recent price. Price-to-book ratio is the price divided by book value per share. Price-to-cash flow is priced divided by NTM cash flow. EY minus Baa yield is the forward earnings yield (consensus analyst estimates of EPS over the next 12 months divided by price) minus the Moody’s Baa seasoned corporate bond yield. Std. dev. over-/under-valued is calculated using the average and standard deviation over 30 years for each measure. Data as of June 30, 2024
Earnings remain strong, but valuations moderate
Disclosures: S&P Global. The price-to-earnings ratio (P/E ratio), is a valuation metric used to assess how much investors are willing to pay for each dollar of a company’s earnings. EPS is based on NTM consensus estimates. NTM = Next 12-months. Latest available data as of 3/31/2025.
7 of 11 sectors posted gains in Q1 as recent trends reversed
Disclosures: Past performance is no guarantee of future results. All performance data represents price returns. S&P 500 represented by the S&P 500 ETF (SPY). Sectors are represented by the following ETFs: SPDR Consumer Discretionary Sector ETF (XLY), SPDR Consumer Staples Sector ETF (XLP), SPDR Financial Sector ETF (XLF), SPDR Health Care Sector ETF (XLV), SPDR Industrial Sector ETF (XLI), SPDR Materials Sector ETF (XLB), SPDR Technology Sector ETF (XLK), Vanguard Real Estate ETF (VNQ), SPDR Utilities Sector ETF (XLU), SPDR Energy Sector ETF (XLE), SPDR Communication Services ETF (XLC). Latest available data as of 3/31/2025.
Treasury yields fell in Q1, but longer-term rates remain above the levels seen 6 and 12 months ago
Disclosures: Data based on latest available data sourced from Federal Reserve. The yield curve shows the relationship between interest rates and time-tomaturity.
High Yield Bond spreads rose, but context is key…
Despite the recent uptick, the chart shows credit spreads remain low by historical standards. Compared to past periods of market stress, today’s spread levels suggest financial conditions are still relatively stable, a reflection of the U.S. economy’s overall strength. While investors are concerned about policy uncertainty and the potential for slower growth, the market is not signaling financial distress. However, if spreads continue to widen, it could signal tighter financial conditions and raise concerns about potential defaults. The market will be watching spreads closely.
Disclosures: Federal Reserve – ICE BofA US High Yield Index Option-Adjusted Spread. Latest available data as of 3/31/2025.
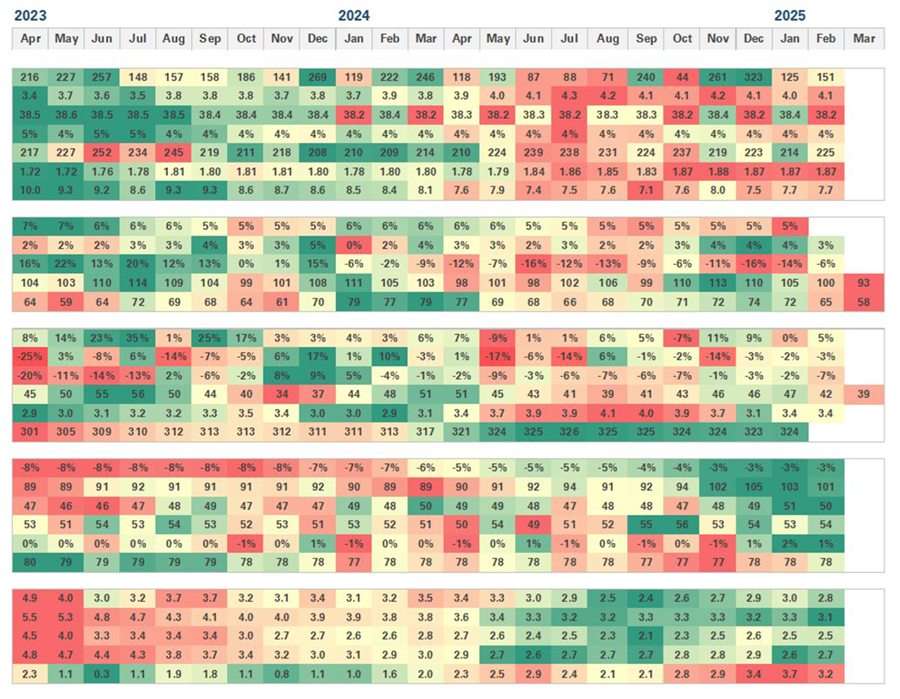
Inflation continues to improve, while the labor market has weakened, and the US consumer confidence has fallen
| Category | Economic Datapoint |
|---|---|
| Labor | Nonfarm Payrolls (000s)
Unemployment Rate (%) Average Workweek (Hours) Average Hourly Earnings (y/y%) Jobless Claims – Initial (000s) Jobless Claims – Continuing (Millions) Job Openings (Millions) |
| Consumer | Personal Income (y/y%)
Retail Sales (y/y%) Domestic Auto Sales (y/y%) Consumer Confidence Index Michigan Confidence Index |
| Housing | New Home Sales (y/y%)
Housing Starts (v/y%) Building Permits (y/y %) Homebuilder Sentiment Index Monthly Supply (# of months) National Home Price Index (9000s) |
| Business | Leading Economic Index (y/y%)
NFIB Small Business Index Manufacturing PMI Services PMI Industrial Production (yly%) Capacity Utilization (%) |
| Inflation | Headline CPI (y/y%)
Core CP| (y/y%) Headline PCE (y/y%) Core PCE [y/y %) Producer Price Inflation (yfy %) |
Disclosures: Data sourced from Federal Reserve, NBER, Redbook, Institute for Supply Management, University of Michigan, DOL, U.S. Census Bureau, NAHB. Red = Worst (5th percentile). Green = Best (95th percentile)
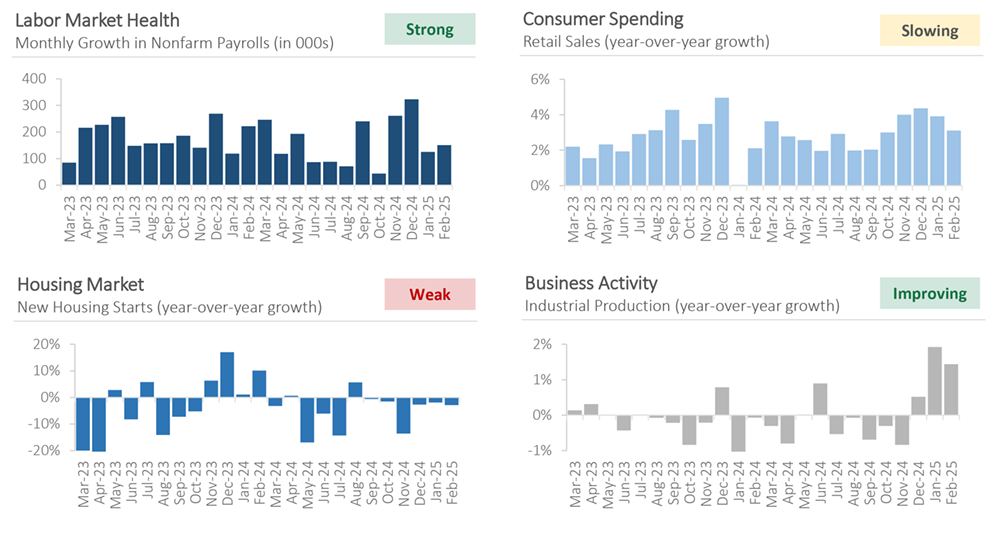
Economic back drop remains mixed…
Disclosures: Department of Labor, U.S. Census Bureau, and Federal Reserve. Latest available data as of 3/31/2025.
Household income expectations have dropped which is concerning since consumer spending drives US GDP…
Source: University of Michigan, Bloomberg, Apollo Chief Economist
…and there are signs that international demand is falling as well
Source: Apollo
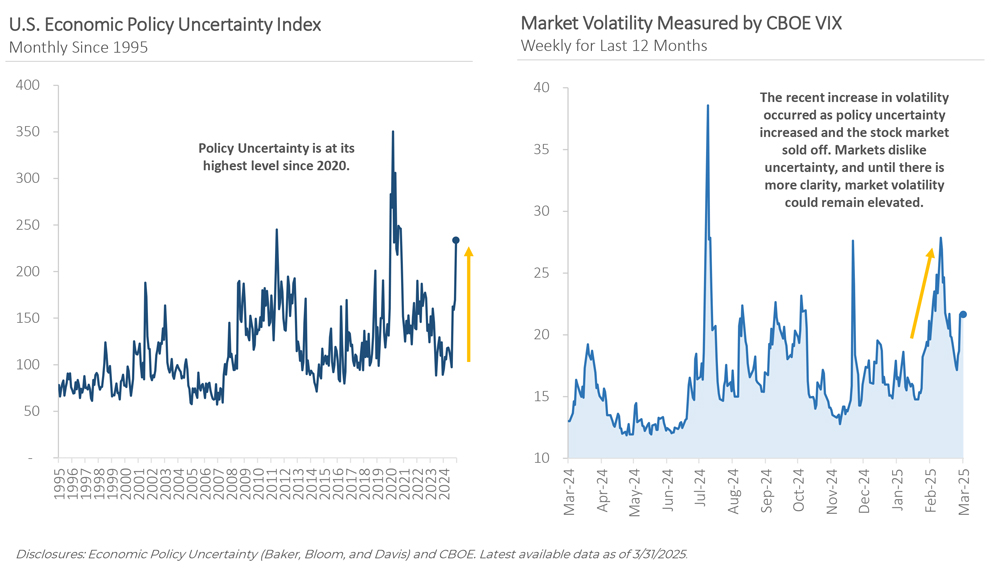
But Policy Uncertainty Has Increased Market Volatility
Disclosures: Economic Policy Uncertainty (Baker, Bloom, and Davis) and CBOE. Latest available data as of 3/31/2025.
Q1 2025 had increased volatiliy… then came April
“Liberation” Day and #TariffTantrum impact
Tariff announcements were nothing short of a watershed moment
The Trump administration announced sweeping tariffs on April 2, which were described by one analyst as “worse than the worstcase scenario.”1 According to some estimates, if the announced tariffs go into effect, the average US tariff rate will surpass the highest levels of the past century.2 On April 9 the administration announced a 90 day pause of the “reciprocal” tariffs, but uncertainty remains about the ultimate outcome.
Source: 1. Joseph Adinolfi, “Trump tariffs amount to ‘worse than worst-case scenario’ as investors brace for stock-market beatdown,” MarketWatch, April 2, 2025, 2. Paul Krugman, “Will Malignant Stupidity Kill the World Economy?,” Paul Krugman, April 3, 2025.
Tariff Impact on Future Earnings
Tariff Impact on U.S. Recession
Wall Street strategists have lowered their earnings forecasts and year-end S&P 500 price targets. According to bettors on Polymarket, the odds of a US recession this year have increased from as low as 21% earlier this year to 54%, after peaking around 66% during the first ten days of April
Source: Polymarket, “US recession in 2025,” https://polymarket.com/event/us-recession-in-2025. Accessed April 16, 2025.
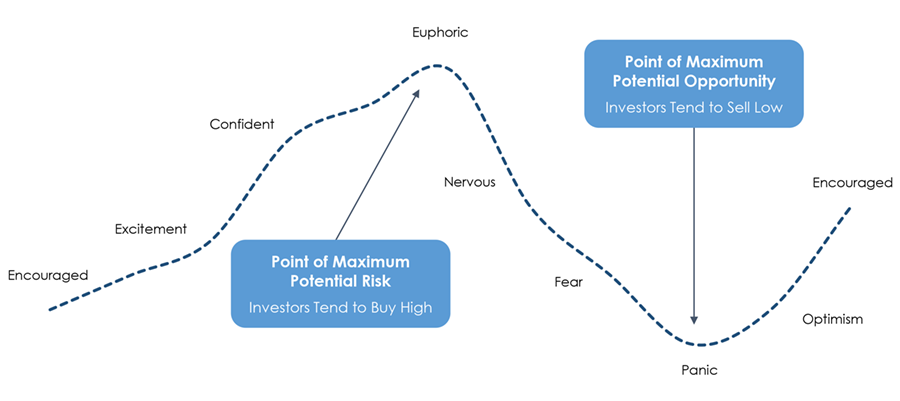
The Cycle of Market Emotions – Don’t let yours get the best of you
Disclosures: Strictly for illustrative and educational purposes only. This analysis is not a recommendation, offer or solicitation to buy or sell any securities or to adopt any investment strategy.
Remember the Importance of Diversification
Disclosures: Past performance is no guarantee of future results. Performance is for illustrative purposes only. Diversification does not guarantee a profit or protect against a loss in a declining market. Diversified Portfolio is represented by 40% Large Caps (SPY – SPDR S&P 500 ETF), 10% Developed Markets (EFA – iShares MSCI EAFE ETF), 5% Small Caps (IWM – iShares Russell 2000 ETF), 30% Bonds (AGG – iShares U.S. Aggregate Bond ETF), 10% High Yield (HYG – U.S. Corporate High Yield Bond ETF), and 5% Emerging Markets (EEM – iShares MSCI Emerging Markets ETF). Standard deviation is a measure of the amount of variation of each portfolio. Data as of 04/01/2025
Time, Not Timing, is What Matters
Disclosures: Past performance is no guarantee of future results. The analysis is based on 20 years of daily price return data. The portfolio value is represented by the State Street SPDR S&P 500 ETF (SPY), which represents an index of large cap stocks. The analysis does not include the impact of taxes or capital gains. Data as of 04/01/2025
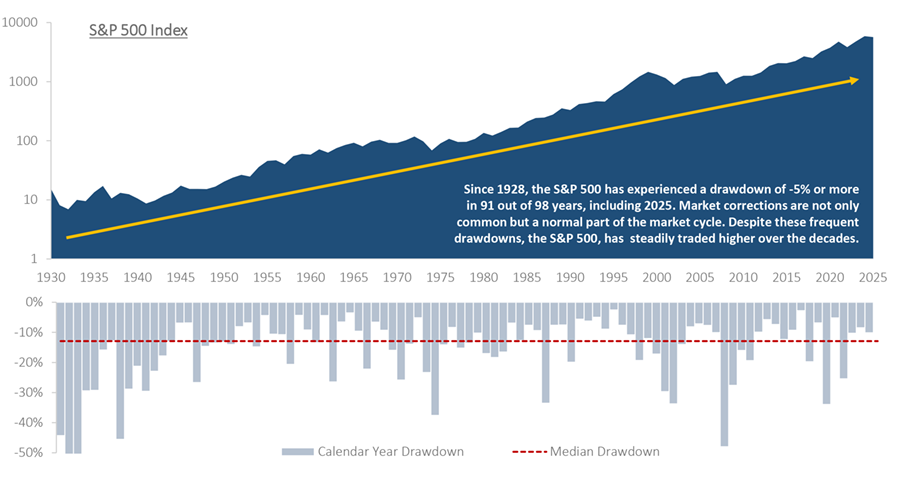
Keep a long-term mindset, volatility is a norm in investing
Disclosures: A logarithmic (lognormal) chart is used to graph the S&P 500, which makes it easier to analyze the long-term market trend. S&P Global. The performance of this index is provided for informational purposes only and does not represent an actual investment. Index performance is for illustrative purposes only and does not reflect any management fees, transaction costs or expenses. Indexes are unmanaged and one cannot invest directly in an index. Past performance does not guarantee future results. Latest available data as of 3/31/2025.
Disclosures
Past performance is not indicative of future results. Sage Mountain Advisors, LLC (“SMA”) is an independent SEC registered investment advisor. Any reference to or use of the terms “registered investment adviser” or “registered,” does not imply that SMA or any person associated with SMA has achieved a certain level of skill or training. This material is provided for informational and educational purposes only.
Any subsequent, direct communication by SMA with a prospective client shall be conducted by a representative that is either registered or qualifies for an exemption or exclusion from registration in the state where the prospective client resides. For more information pertaining to the registration status of SMA, please contact SMA or refer to the Investment Adviser Public Disclosure website (www.adviserinfo.sec.gov). The information contained herein should not be construed as personalized investment, tax, or legal advice. Certain information contained in this presentation has been derived from third party sources. While we believe these sources to be reliable, we make no representations as to the accuracy, timeliness, and completeness of any such information prepared by any unaffiliated third party incorporated herein, and take no responsibility therefore. As such, there is no guarantee that the views and opinions expressed in this presentation will come to pass.
All investments carry a certain degree of risk of loss, and there is no assurance that an investment will provide positive performance over any period of time. The statements contained herein reflect opinions, estimates and projections of SMA as of the date hereof, and are subject to change without notice. SMA reserves the right to modify its current investment strategies and techniques based on changing market dynamics or individual portfolio needs. The opinions expressed herein are those of SMA and are subject to change without notice. Information presented should not be considered as a solicitation or recommendation to buy or sell any security, financial product, or instrument discussed herein. Additionally, this material contains certain forward-looking statements which point to future possibilities. Due to known and unknown risks, other uncertainties and factors, actual results may differ materially from the results portrayed or implied in such forward-looking statements. Furthermore, the illustrative results presented in this presentation in no way reflect the performance of any SMA product or any account of any SMA client, which may vary materially from the results portrayed for various reasons, including but not limited to, investment objectives, financial situations and financial needs of SMA clients; differences in products and investment strategies offered by SMA; and other factors relevant to the management of SMA client accounts.
This presentation and its contents are provided “as is” without warranty of any kind, express or implied, including, but not limited to, implied warranties of merchantability, fitness for a particular purpose, title, non-infringement, security, or accuracy. SMA reserves the right to modify its current investment strategies and techniques based on changing market dynamics or client needs. It should not be assumed that any of the security transactions, holdings or sectors discussed were or will prove to be profitable, or that the investment recommendations or decisions we make in the future will be profitable or will equal the investment performance of the securities discussed herein.
Actual investment advisory fees incurred by clients may vary. A complete description of SMA’s fee schedule can be found in Part 2 of its FORM-ADV which is available at www.sagemountainadvisors.com or by calling (404) 795-4861. Clients are advised that no portion of the services provided by SMA should be interpreted as legal, tax or accounting advice. For legal and tax-related matters, we recommend that you seek the advice of a qualified attorney, accountant or tax professional. SMA-25-0206

