SAGE MOUNTAIN 945 East Paces Ferry Rd NE, Suite 2660, Atlanta, GA 30326
Sage Mountain Research
Market Update – Q2 2024
Markets push higher in Q2, despite growth slowdown and political concerns.
The stock market is off to a strong start this year, with the S&P 500 gaining over +15%. Economic data has softened, raising the question of whether the economy is slowing or simply returning to normal. Investors started this year expecting the Federal Reserve to cut interest rates in March; however, they are still waiting for the first interest rate cut.
In Q2, there was an increase in the number of negative economic surprises as the U.S. economy underperformed expectations. Investors are debating what the recent negative surprises indicate. Are they the start of a new trend toward slower economic growth? If so, how much could the economy slow? Markets will closely monitor economic data in the third quarter.
The market remained focused on the Fed’s policy guidance in the second quarter as inflation eased and economic data softened. However, there was no major shift in expectations, and investors still expect a rate cut later this year.
The stock market experienced ups and downs this quarter. In April, stocks traded lower, reversing some of the earlier gains from Q1. In May, stocks rebounded, and the S&P 500 finished the quarter by setting multiple new all-time highs.
One notable theme in the stock market this year has been the outperformance of the largest companies. The S&P 500 Index gained +4.3% in Q2, increasing its 2024 return to more than +15%. In contrast, the Russell 2000 Index of small cap companies fell by -3.3%, lowering its 2024 return to +1.7%.
International stocks underperformed U.S. stocks in Q2, but performance was mixed. The MSCI Emerging Market Index gained +5.0%, comparable to the S&P 500’s return. However, the MSCI EAFE Index of developed market stocks returned -0.4%. The two main international stock market indices have underperformed U.S. stocks by almost -10% this year, despite mid-single-digit gains.
The second half of 2024 will be busy. Investors expect the Federal Reserve to start cutting interest rates before year-end, but the projected timing of the first rate cut remains uncertain. The second-quarter earnings season starts in mid-July, which will provide an opportunity to hear updated commentaries from companies. There is a renewed focus on economic data and the economy’s trajectory, and the presidential election will take place in November. We will continue to monitor financial markets and the economy, provide timely updates, and adjust portfolios as needed.
Year End Recommendations in Hindsight
FIXED INCOME
We recommended modestly increasing duration late last year. Despite delays in expected interest rate cuts, the 10-year Treasury yield has declined from a peak of just below 5% to 4.3% as the economy shows some signs of slowing and clear progress on inflation.
In the first half of 2024, many carryover positions from 2023 continued to add value. Examples of fixed income investments we have allocated to include the Janus Henderson AAA CLO ETF, the Cliffwater Corporate Lending Fund, and the Principal Street Intermediate Duration Municipal bond SMA. For comparison, the Bloomberg US Aggregate has returned -0.7% year to date, the Bloomberg US Corporate High Yield index +2.6%, and the Bloomberg Municipal 1-10 Year Blend -0.8%.
We believe the opportunity to add value in fixed income will largely come from manager selection and by only taking risks for which you are appropriately compensated.
We expect rates to be less volatile as inflation subsides.
EQUITIES
Our public equities recommendations were unchanged in the first half and continued to work well. These include investing with a 4:1 overweight of US vs. international equities and favoring quality as a factor tilt.
The boring but time-tested advice continues to be, “remain invested.” With half the year over, the MSCI All Country World index rose +11.3%, the S&P outperformed again by rising
+15.3%, and the MSCI EAFE index of international stocks returned +5.3%. The dollar continues to be very strong, making international stock returns in US dollars lower than returns measured in local currency of +11.1%. The basic story remains the same – US stocks trade at higher valuations but have also delivered much more earnings growth. This dynamic seems unlikely to change without a catalyst.
The quality factor continued to perform well, although the more concentrated iShares MSCI USA Quality Factor ETF outperformed the more diversified JPMorgan U.S. Quality Factor ETF which we currently prefer.
ALTERNATIVES
Throughout much of last year and into 2024 we recommended secondaries funds across asset classes, diversified venture capital funds with fresh capital to deploy at attractive valuations, and real estate credit. The fundraising environment has been difficult for most funds which has given us the opportunity to continue adding new commitments this year.
Private equity has felt the impacts of higher rates and a reduced number of portfolio company exits. We have generally favored investing with managers that utilize lower leverage and purchase companies at lower valuations, as well as secondaries funds. We continue to believe both are well- positioned in this environment.
Private real estate is a mixed bag. Demand for housing, industrial, and medical office remains strong, but managers that utilized too much leverage or were counting on interest rates declining have suffered. While we haven’t been immune from those issues, diversification has helped limit our clients’ exposure to any single project or fund.
We are continuing to allocate to a real estate secondaries fund which we believe will be able to take advantage of that stress. Outside of that, we still lean towards credit within real estate. One of our larger investments in the first half of the year has been in multifamily loans, where we belive the scarcity of bank credit and higher short-term rates may lead to higher returns.
We expect multifamily rents to rise in coming years as the sharp reduction in new construction results in a supply shortage. It may soon be time to start adding new investments in value-add or development projects which can take advantage of that limited supply, but we have not yet made that shift.
While it is still too early to judge the returns of alternative investments made in 2023 and 2024, we remain optimistic about the long-term outlook.
Market Snapshot

Investment grade fixed income was flat in Q2 as markets continue to wait and see about rate cuts, and credit spreads remained tight.
Equities continued their trends from the first quarter as US markets led International, Growth outpaced Value, while Emerging Markets bounced back
Source: Addepar; data as of 6/30/2024
1 Returns as of 12/31/2023
2 Returns as of 3/31/2024
Oil prices gave back some gains but remains starkly positive for 2024. The US Dollar continued its strength, rising
+4.5% in the first half of 2024. As investors continue to be cautious about inflation, gold has benefitted returning +12.9% this year thus far.
A 60% equity / 40% bond portfolio rose +2.6% in Q2, and
+8.9% for the year driven by positive equity returns.
Strong first half returns for equities are usually followed by above average returns over the remainder of the year
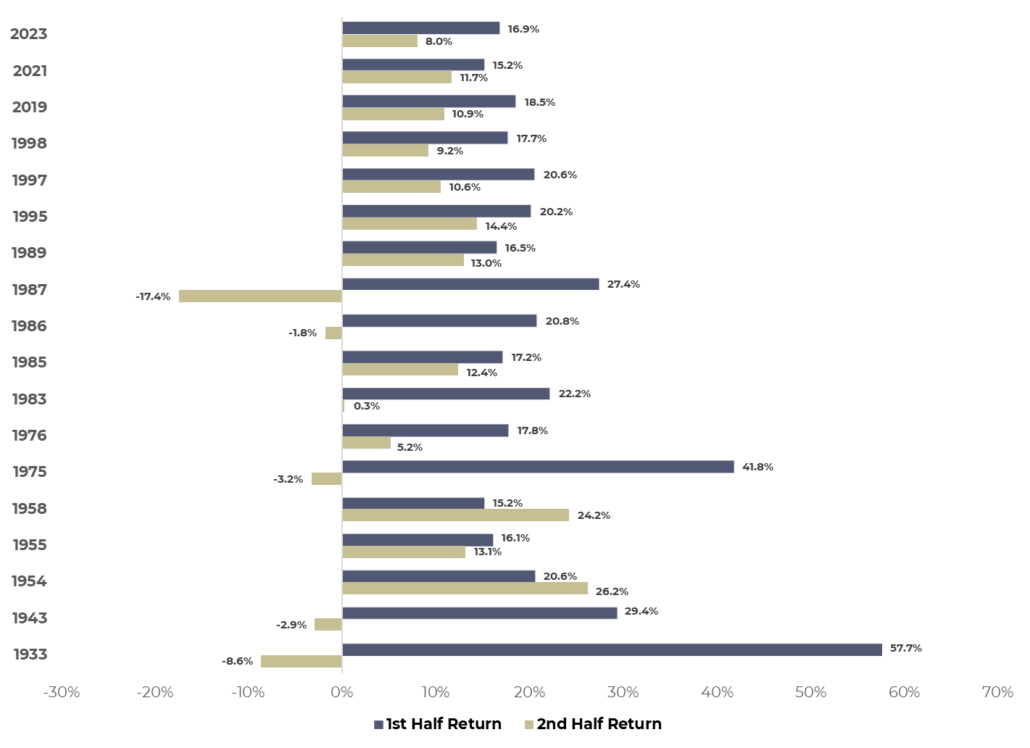 Since 1928, the S&P 500 has returned >15% in the first half 18 times, including last year. The second half return has averaged 7% in those years vs. an average of 6% in all years.
Second half returns have been positive in 13 out of those 18 years, or 72% of the time. The largest second half loss was -17.4% driven by Black Monday in 1987, the second largest was -8.6% during the height of the Great Depression in 1933, and the third largest was just -3.3% in 1975.
Missing the run up to equity market peaks has historically been more detrimental to returns than staying too long…
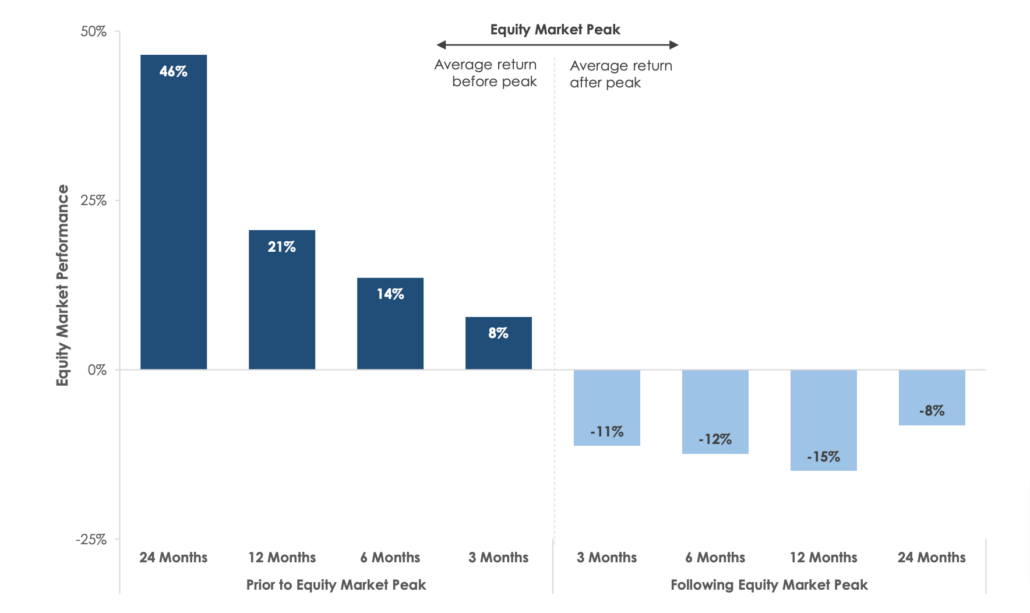
Source: MarketDesk
Disclosures: All performance data represents price returns of the S&P 500. The analysis is based on 14 bull/bear market cycles since 1937. Bear Markets are defined as
a decline of at least 20% from the market’s high point to its low.
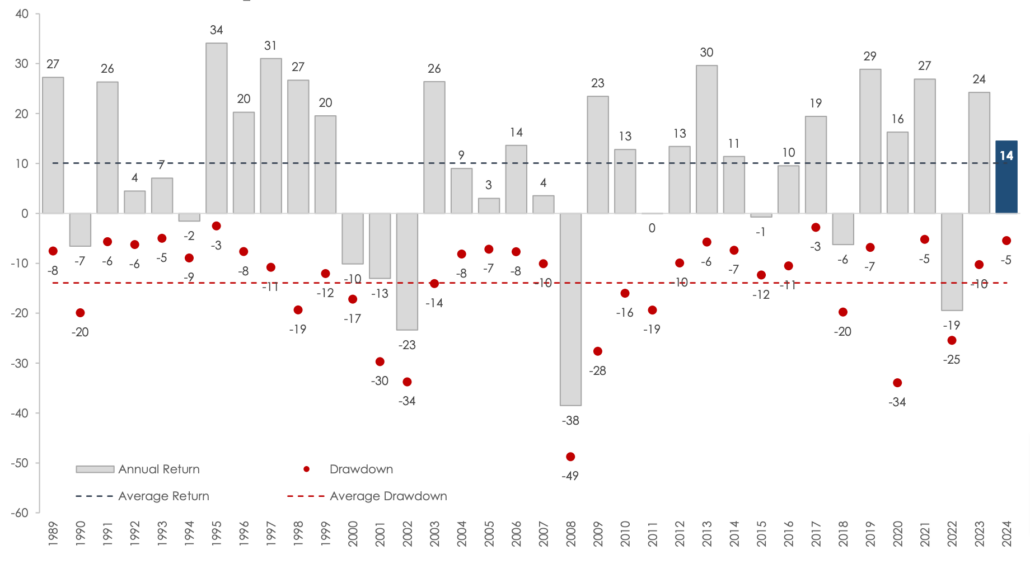
…and even in years with strong positive returns investors should still expect drawdowns
Source: MarketDesk
Disclosures: For illustrative purposes only. All performance data represents price returns and does not include dividends for the stated period. Drawdown is calculated from the intra-year peak to trough levels. Analysis is based on the State Street SPDR S&P 500 ETF (SPY). Data as of June 30, 2024.
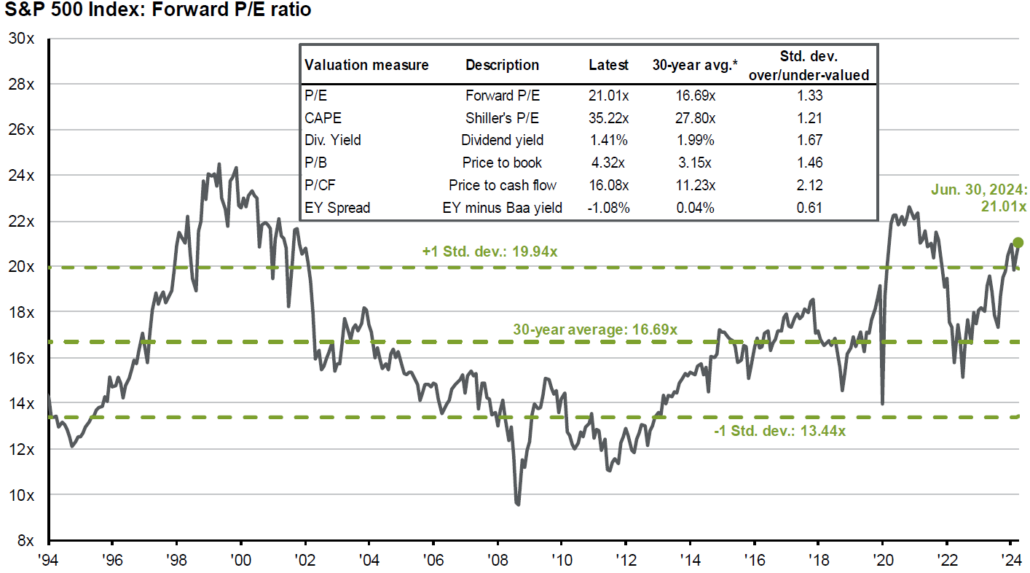
Valuations are on the rise, as stocks continued to climb on the back of economic data and earnings
Source: JP Morgan Asset Management
Price-to-earnings is price divided by consensus analyst estimates of earnings per share for the next 12 months as provided by IBES since March 1994 and by FactSet since January 2022. Average P/E and standard deviations are calculated using 30 years of history. Shiller’s P/E uses trailing 10-years of inflation-adjusted earnings as reported by companies. Dividend yield is calculated as the next 12-months consensus dividend divided by most recent price. Price-to-book ratio is the price divided by book value per share. Price-to-cash flow is priced divided by NTM cash flow. EY minus Baa yield is the forward earnings yield (consensus analyst estimates of EPS over the next 12 months divided by price) minus the Moody’s Baa seasoned corporate
bond yield. Std. dev. over-/under-valued is calculated using the average and standard deviation over 30 years for each measure. Data as of June 30, 2024.
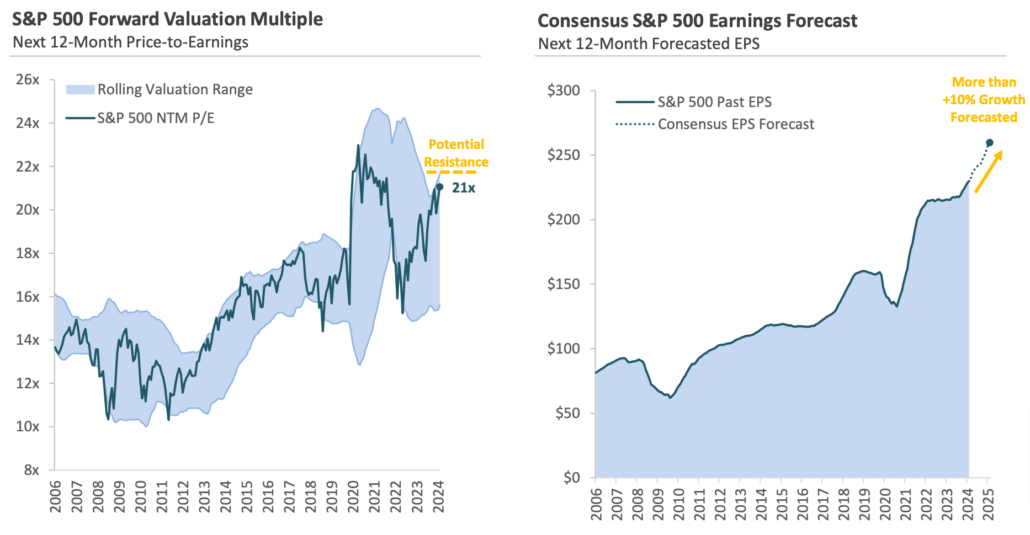
But what is driving performance, earnings growth or valuations?
Source: MarketDesk
Disclosures: Data is based on the State Street SPDR S&P 500 ETF (SPY). Rolling Valuation Range is calculated as the rolling 2-year average plus and minus the rolling 2-year standard deviation multiplied by two (i.e., 2-year average +/- 2 stdev). A standard deviation is a measure of how dispersed the data is in relation to the mean. NTM = next 12-months. Latest available data as of 6/30/2024.
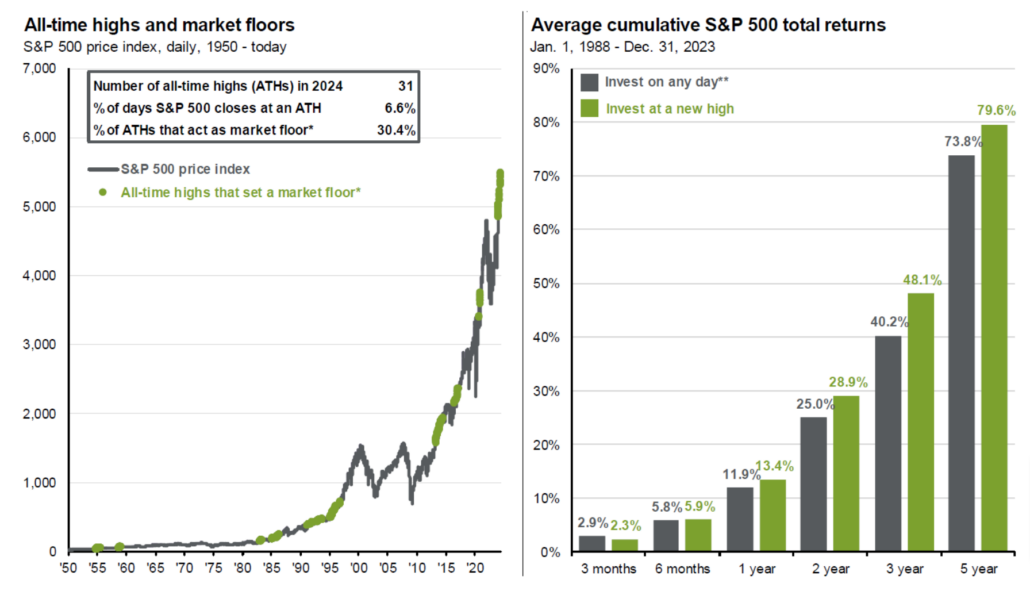
As investors worry over potential market peaks…history shows markets highs lead to more highs
Source: FactSet, Standard & Poor’s, JP Morgan
(Left) *Market floor is defined as an all-time high from which the market never fell more than 5%. (Right) **”Invest on any day” represents average of forward returns for the entire time period whereas “Invest as a new high” represents average of rolling forward returns calculated from each new S&P 500 high for the subsequent 3-months, 6-months, 1-year, 2-year and 3-year intervals, with data starting 1/1/1988 through 12/31/2023. Data as of June 30, 2024
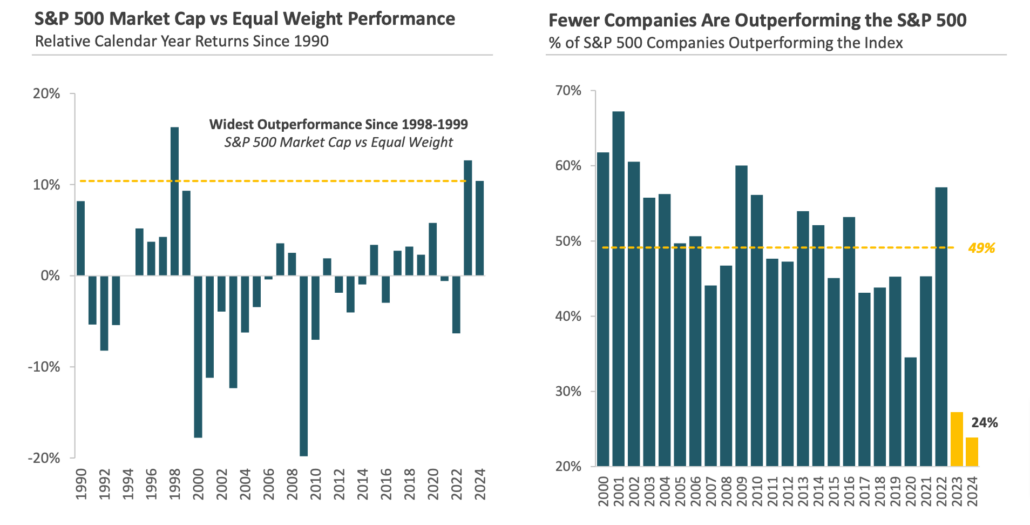
Equities remain concentrated at the top, reinforcing the need for broad market diversification…
Source: FactSet, Standard & Poor’s, JP Morgan Asset Management
The top 10 S&P 500 companies are based on the 10 largest index constituents at the beginning of each month. As of 6/30/2024, the top 10 companies in the index were MSFT (7.0%), AAPL (6.3%), NVDA (6.1%), AMZN (3.6%), META (2.3%), GOOGL (2.3%), BRK.B (1.7%), LLY (1.5%), JPM (1.3%), and AVGO (1.3%). The
remaining stocks represent the rest of the 492 companies in the S&P 500. Data as of June 30, 2024.
…but it has been the biggest companies outperforming in 2024…
Source: MarketDesk
Disclosures: Past performance is no guarantee of future results. Data is sourced from Standard & Poor’s. Latest available data as of 6/30/2024.
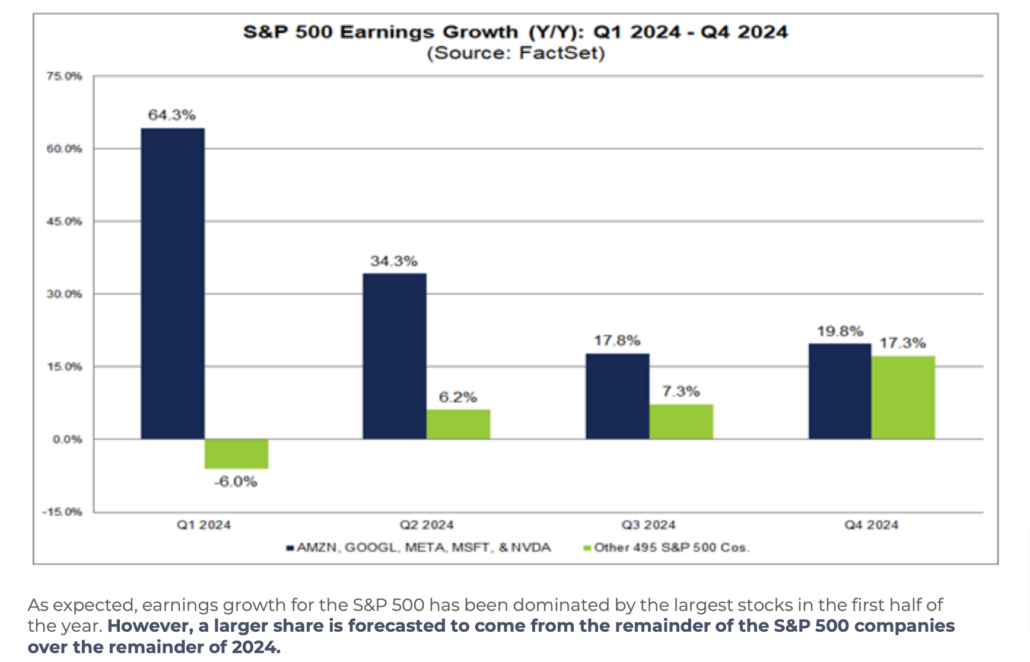
…and what should we expect from the rest?
As expected, earnings growth for the S&P 500 has been dominated by the largest stocks in the first half of the year. However, a larger share is forecasted to come from the remainder of the S&P 500 companies over the remainder of 2024.
Source: FactSet
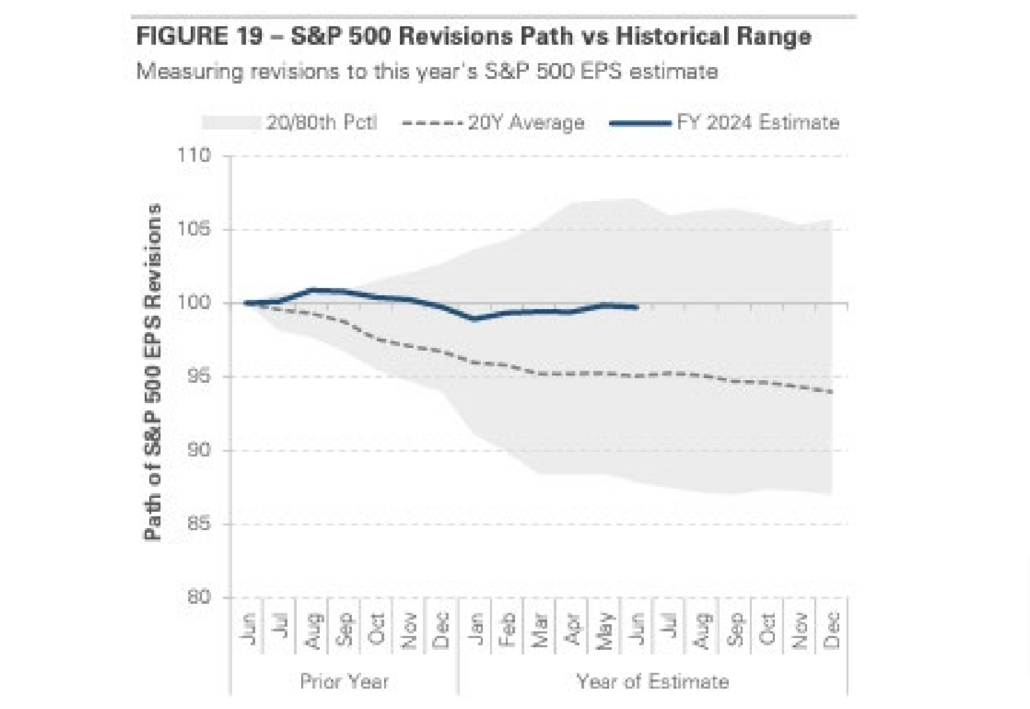
Earnings estimates have been much more stable in 2024 than in prior years
Source: MarketDesk. Estimate indexed to 100 on June 30th of Prior Year. Data as of June 30, 2024
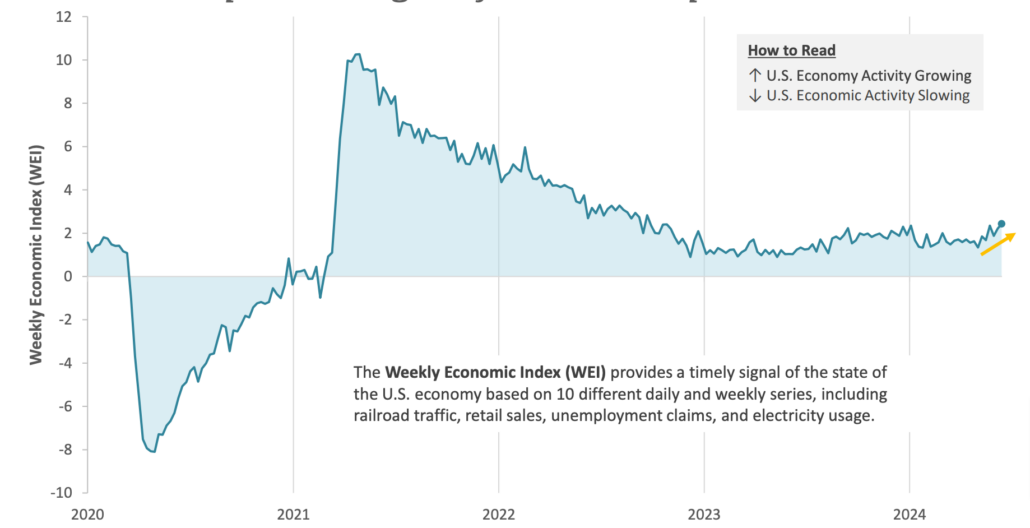
U.S. economic growth briefly stalled, but real time data shows positive signs of renewed expansion
Source: MarketDesk Disclosures: Data is sourced from Federal Reserve. Latest available data as of 6/21/2024.
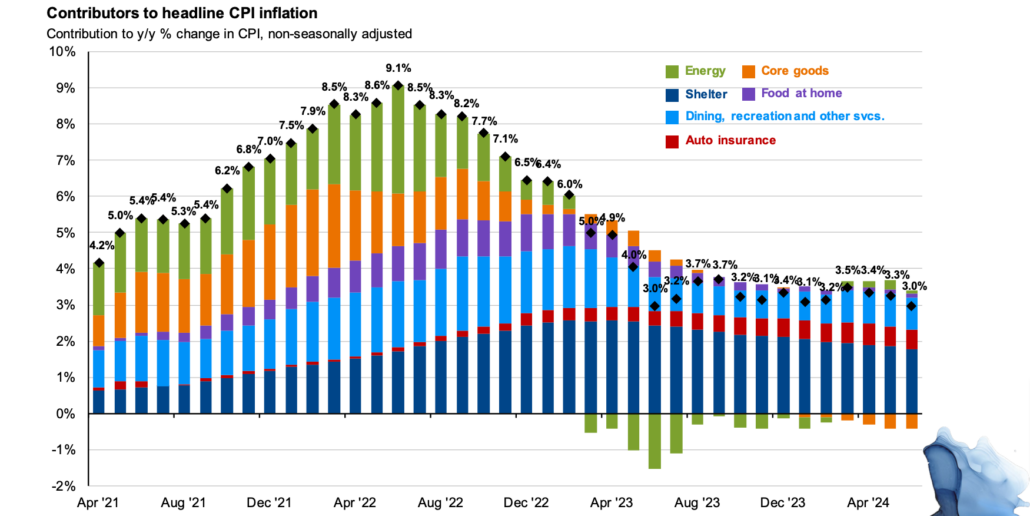
Inflation has subsided, but above long-term targets
After two years of raging inflation, we saw a steady downtrend in the second half of 2023. The progress halted early in 2024, but has resumed over the past 3 months. Year over year CPI inflation fell to 3.0% in June, down from 3.5% in March and a peak of 9.1% in mid-2022. Core PCE, the Fed’s preferred measure of inflation, increased 2.6% over the past 12 months through May.
With the recent softening of inflation data, the market has begun increasing expectations for rate cuts with 3 cuts of 0.25% between now and the end of January 2025 currently priced in.
Source: BLS, FactSet, J.P. Morgan Asset Management
Contributions mirror the BLS methodology on Table 7 of the CPI report. Values may not sum to headline CPI figures due to rounding and underlying calculations. “Shelter” includes owners’ equivalent rent, rent of primary residence and home insurance. Data as of July 11, 2024.
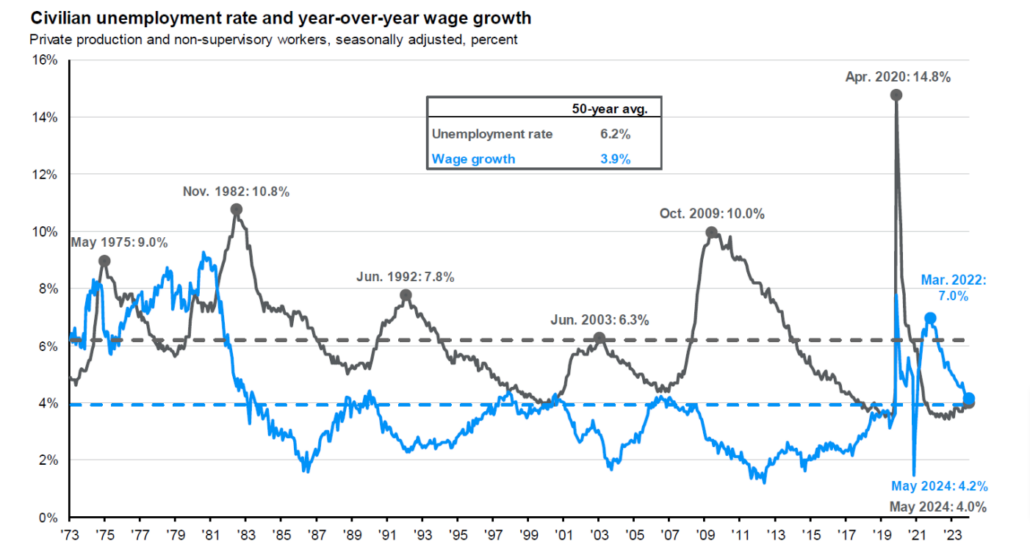
Unemployment and wage growth remain resilient, despite growing concerns
As strong growth remains in the U.S. labor supply, boosted by an increased labor force participation and a surge in immigration, the U.S. economy has experienced strong job gains without greater inflation. With job openings still elevated, modest economic growth should support steady job gains ahead. While this normally puts downwards pressure on the unemployment rate, the continued inflow of migrants adding to labor supply could keep the unemployment rate within a narrow range of 3.5% to 4.0%.
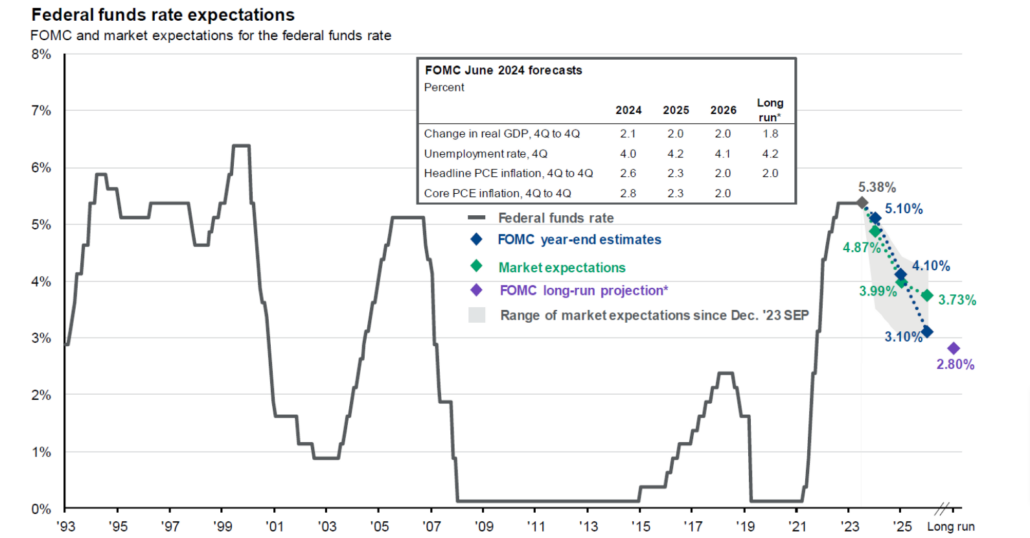
Financial markets are focused on interest rates, as pauses loom and the soft-landing remains elusive
Source: Bloomberg, FactSet, J.P. Morgan Asset Management
During the quarter, The Federal Reserve continued its cadence of interest rate pauses in both May and June, following stronger than anticipated economic data.
As GDP growth, inflation, and labor market statistics remained resilient, the Fed saw no indication of a market slowdown or a need to begin cutting interest rates. As we came into the year with a projected 6 quarter-point cuts in 2024, economists have slashed those projections to 1 cut through 2024, with some hypothesizing there may be none.
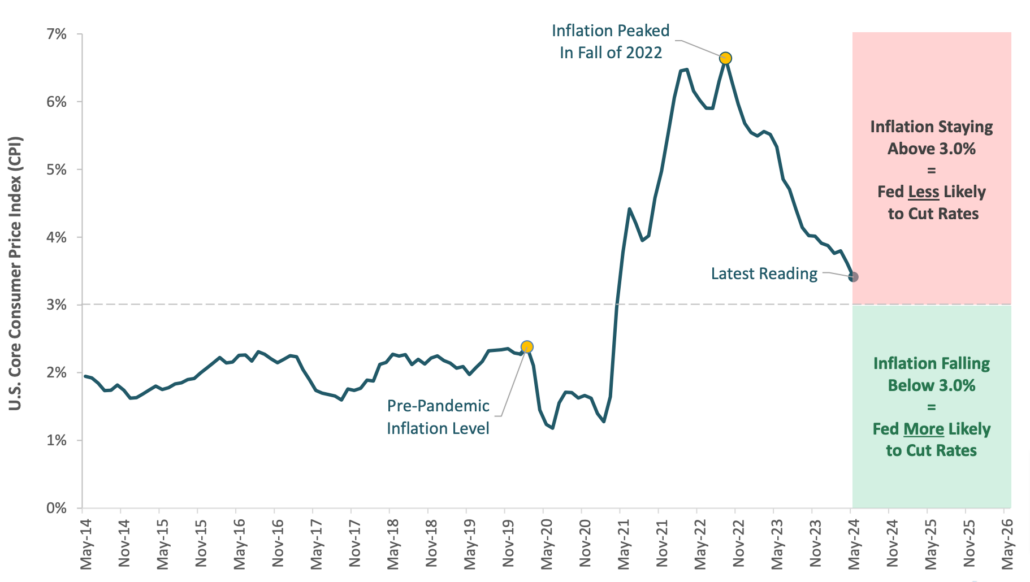
But what is the Federal Reserve waiting for?
Source: MarketDesk
Disclosures: Data is sourced from U.S. Bureau of Labor Statistics. Core Consumer Price Index (CPI) excludes food and energy. Latest available data as of 6/30/2024.
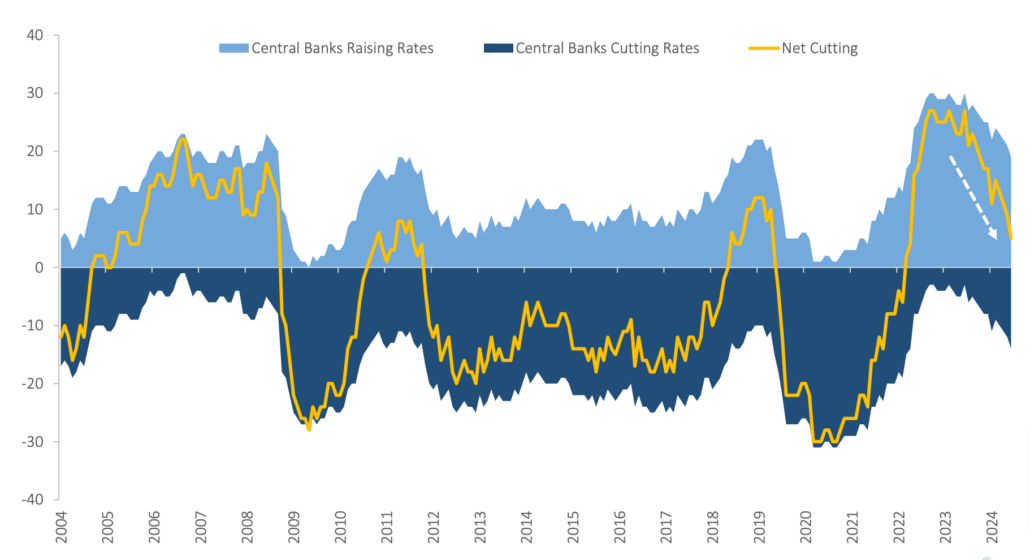
More Central Banks are starting to cut interest rates
Source: MarketDesk
Disclosures: Data is sourced from Federal Reserve and individual central banks. Latest available data as of 6/30/2024.
Disclosures
Past performance is not indicative of future results. Sage Mountain Advisors, LLC (“SMA”) is an independent SEC registered investment advisor. Any reference to or use of the terms “registered investment adviser” or “registered,” does not imply that SMA or any person associated with SMA has achieved a certain level of skill or training. This material is provided for informational and educational purposes only.
Any subsequent, direct communication by SMA with a prospective client shall be conducted by a representative that is either registered or qualifies for an exemption or exclusion from registration in the state where the prospective client resides. For more information pertaining to the registration status of SMA, please contact SMA or refer to the Investment Adviser Public Disclosure website (www.adviserinfo.sec.gov). The information contained herein should not be construed as personalized investment, tax, or legal advice. Certain information contained in this presentation has been derived from third party sources. While we believe these sources to be reliable, we make no representations as to the accuracy, timeliness, and completeness of any such information prepared by any unaffiliated third party incorporated herein, and take no responsibility therefore. As such, there is no guarantee that the views and opinions expressed in this presentation will come to pass.
All investments carry a certain degree of risk of loss, and there is no assurance that an investment will provide positive performance over any period of time. The statements contained herein reflect opinions, estimates and projections of SMA as of the date hereof, and are subject to change without notice. SMA reserves the right to modify its current investment strategies and techniques based on changing market dynamics or individual portfolio needs. The opinions expressed herein are those of SMA and are subject to change without notice. Information presented should not be considered as a solicitation or recommendation to buy or sell any security, financial product, or instrument discussed herein. Additionally, this material contains certain forward-looking statements which point to future possibilities. Due to known and unknown risks, other uncertainties and factors, actual results may differ materially from the results portrayed or implied in such forward-looking statements. Furthermore, the illustrative results presented in this presentation in no way reflect the performance of any SMA product or any account of any SMA client, which may vary materially from the results portrayed for various reasons, including but not limited to, investment objectives, financial situations and financial needs of SMA clients; differences in products and investment strategies offered by SMA; and other factors relevant to the management of SMA client accounts.
This presentation and its contents are provided “as is” without warranty of any kind, express or implied, including, but not limited to, implied warranties of merchantability, fitness for a particular purpose, title, non-infringement, security, or accuracy. SMA reserves the right to modify its current investment strategies and techniques based on changing market dynamics or client needs. It should not be assumed that any of the security transactions, holdings or sectors discussed were or will prove to be profitable, or that the investment recommendations or decisions we make in the future will be profitable or will equal the investment performance of the securities discussed herein. Actual investment advisory fees incurred by clients may vary. A complete description of SMA’s fee schedule can be found in Part 2 of its FORM-ADV which is available at www.sagemountainadvisors.com or by calling (404) 795-4861. Clients are advised that no portion of the services provided by SMA should be interpreted as legal, tax or accounting advice. For legal and tax-related matters, we recommend that you seek the advice of a qualified attorney, accountant or tax professional. SMA-24-0172