SAGE MOUNTAIN 945 East Paces Ferry Rd NE, Suite 2660, Atlanta, GA 30326
Sage Mountain Research
Q2 2025 Market Update
Q2 recap: it was the best of times, it was the worst of times
Pardon the cliché, but the second quarter was a tale of two markets. After declining over -20% from the peak on February 19 to the trough on April 8 and -12% in just four trading days in early April, the S&P 500 closed the quarter at a new all-time high.
The year began with a cloud of uncertainty hanging over Wall Street as investors grappled with three key concerns: unclear government policies, fears of economic slowdown, and growing questions about whether the artificial intelligence boom could sustain its momentum. This cautious mood kept many investors on the sidelines, creating a challenging environment for stocks throughout the first quarter. However, the script flipped dramatically in the second quarter as worries faded. Policy tensions cooled, trade impacts proved less severe than feared, and companies surprised everyone with stronger-than-expected first-quarter earnings.
The dramatic contrast between these two quarters serves as a powerful reminder of how quickly markets can change direction, often driven more by investor emotions and expectations than by immediate economic realities. Forecasts for US equity returns and interest rates whipsawed throughout the first half of the year. The consensus year-end price target for the S&P 500 moved from 6,614 coming into the year to 6,047 in mid-April to 6,077 now. Strategists who have updated their price targets in the past month have an average price target of 6,371. Markets came into the year pricing in 1.7 Fed rate cuts this year, increased to 4.1 rate cuts before Trump paused some tariffs on April 9, and are now back to expecting 2.0 cuts through year end. Using odds from Polymarket, the chances of a US recession in 2025 increased from about 20% to nearly 70% before declining back to 22%. For investors, this roller-coaster first half of the year underscores why patience and a long-term perspective remain essential ingredients for investment success.
Despite all the drama, “risk-on” assets such as stocks and high-yield bonds performed well. The S&P 500 delivered a solid +6.1% return through the end of June, and the BofA-ICE High Yield Index returned nearly +5%. This represented a remarkable improvement from the equity market trough, with the S&P 500 down more than -15%, prompting many investors to wonder if they were witnessing the start of a prolonged downturn.
Similarly, long-term interest rates, as measured by the 30-year Treasury bond, took investors on their own roller-coaster ride, swinging between 4.40% and 5.10% before settling back near 4.80% – almost exactly where they started in January. Even U.S. stock valuations, after all the market volatility, returned to levels similar to the beginning of the year as earnings grew.
Despite the reversal from Q1 to Q2, one trend remained intact. International stocks outperformed U.S. stocks for a second straight quarter, with developed and emerging market stock indices both returning more than +11% in Q2. Year-to-date, developed and emerging market stocks have returned +19.4% and +15.3%, respectively. Most of the outperformance can be attributed to a weaker U.S. dollar, which is being impacted by tariffs, policy uncertainty, and a rotation out of the U.S. into international assets.
Similar to stocks, the bond market experienced a dramatic mood shift between the first and second quarters. To illustrate this change, we can look at the 30-year U.S. Treasury bond yield. Unlike shorter-term bonds that move primarily based on Federal Reserve decisions, these longer-term bonds reflect investors’ beliefs about the economy’s future; specifically, whether growth and inflation will rise or fall in the years ahead. The 30-year yield’s movement throughout 2025 tells the same story as stocks: initial pessimism giving way to renewed optimism as investors became more confident about economic prospects.
30-year Treasury yields capture how quickly investor fears can shift. In the first quarter, worries about sluggish economic growth and unclear government policies drove investors to seek the safety of longterm bonds, pushing the yield down from 4.80% to 4.40% by early April. But as the second quarter unfolded, investor concerns did a complete about-face – instead of worrying about a weak economy, worries arose around inflation and growing government debt. This flip in sentiment sent the yield soaring to 5.10% in late May before settling back to 4.79% by June’s end.
Corporate bonds bounced back strongly in the second quarter, with riskier high-yield bonds leading the charge after struggling in the first quarter. As investor confidence returned and economic fears faded, companies found it easier and cheaper to borrow money, which directly benefited corporate bond prices. High-yield bonds delivered an impressive +3.5% second quarter return, easily outpacing the +2% return from higher-quality investment-grade corporate bonds.
Few investors could have predicted the wild ride that defined the first half of 2025. While policydriven uncertainty may continue to create volatility in the months ahead, financial markets have demonstrated remarkable resilience in the face of these challenges. The second quarter delivered a powerful reminder of this strength, with the S&P 500 posting its best quarterly performance since late 2023 and completely erasing the first quarter’s losses. This dramatic turnaround showcases the market’s ability to adapt and recover, even when faced with significant uncertainty which reinforces our tenent of staying disciplined and focused on long-term returns.
Our outlook for 2nd half 2025
Our outlook, in a nutshell: Our 2H view on equities, fixed income, and private investments is positive. We believe views at both extremes—demand collapsing and recession, and deficit-fueled overheating and inflation—are overblown. For US equities, a rising but still narrow market, dominated by high-quality stocks, is our best guess. We believe that some reallocation out of the US will continue, supporting international stocks performing better relative to the US than they have since the Great Recession.
Several themes underlie our views:
- Earnings continue to grow and Wall Street’s strategists have had to take their estimates up. Large S&P 500 companies are maintaining high margins and are able to protect margin through staff cuts if necessary.
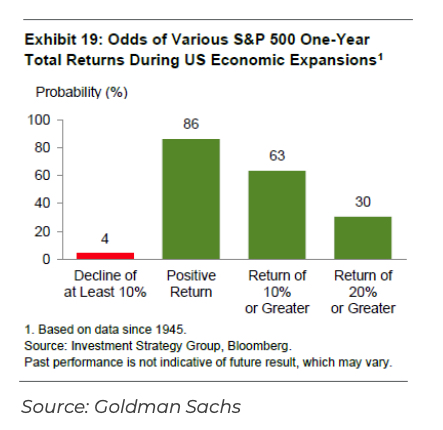
- Despite significant uncertainty, the hard economic data is slower but still expanding. Survey data is contrastingly weak, but surveys have become both more affected by headlines and more partisan than in the past. Historically when the US economy is expanding, equity returns have almost always been positive:
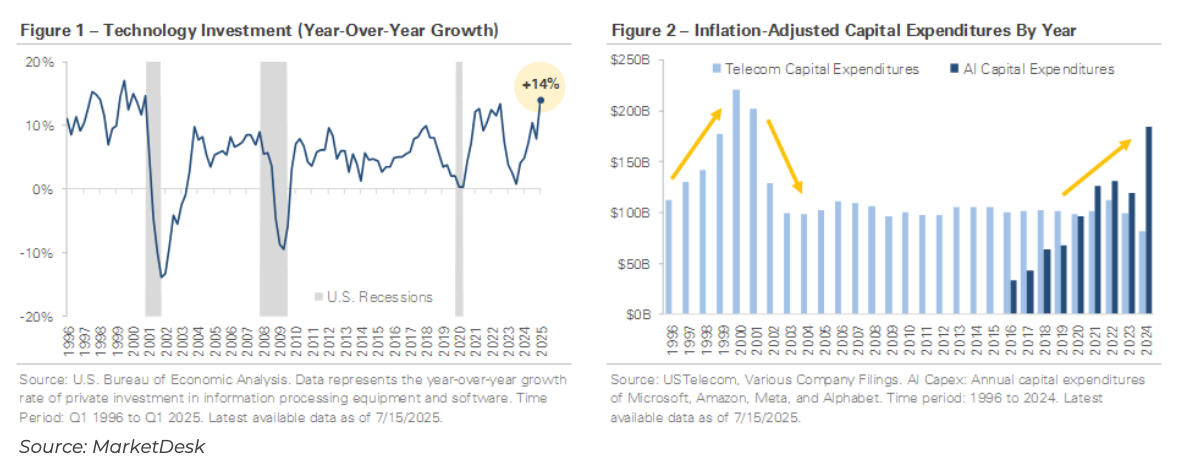
- We are not ready to recommend shifting assets from US to non-US equities based on six months of returns. Much of the outperformance of international equities was driven by a weakening US dollar. While the dollar is not weak relative to history—as the chart on slide 17 shows it is currently trading above its long-term average—we don’t think it’s a stretch to say that it’s unlikely that it will fall nearly -11% every 6 months moving forward. Selling US equities to add to international would likely trigger significant capital gains, creating an additional hurdle for taxable investors to overcome. In addition, AI spending continues to drive the technology sector which is concentrated in the US. The potential of revolutionary AI improvements is compelling, and executives fear being left behind more than excess spending. The AI capital investment boom has accelerated:
- While the recent tax bill expands the federal debt further over time, it avoids a sharp demand hit in the near term.
- The largest immediate problem is one of our own making – tariff uncertainty. While he hates the moniker, so far Trump has served enough TACOs (Trump Always Chickens Out) that the market believes a face-saving compromise will happen.
- Consumers, the ultimate driver of the US economy, are not overleveraged and continue to be employed in nearrecord numbers.
- While the returns of municipal bonds lagged those of taxable bonds in the first half, we believe that was at least partly driven by the municipal bond market being less liquid, and it does not reflect concerns about credit quality. Intermediate-duration municipal bond portfolios yield over 4% with approximately 5.5 years of duration. That compares favorably to 5-year Treasury bonds, which currently yield 4.05% before taxes. Although short-duration municipal bonds have outperformed intermediate-duration this year, intermediate-duration portfolios will benefit from having attractive yields locked in for several years as short-term rates fall if the Fed cuts interest rates as expected.
Market Snapshot

Outside of high-yield municipal bonds, fixed income gained in Q2, as bonds benefited from tensions easing, improved investor sentiment, and signs of inflation moderating.
In a high-volatility environment, US equity markets were whipsawed with sharp declines in April, followed by a historic rally to end the quarter up 10.9%.
In local currency terms, US equities narrowed the gap with international markets, led by large/mega cap and growth. Continued US dollar weakness drove further outperformance from international stocks in dollar terms.
A 60% equity / 40% bond portfolio rose +7.0% in Q2 and recovered its year-to-date performance back to +5.5%.
Key headlines from the past quarter

Disclosures: Standard & Poor’s. The performance of this index is provided for informational purposes only and does not represent an actual investment. Index performance is for illustrative purposes only and does not reflect any management fees, transaction costs or expenses. Indexes are unmanaged and one cannot invest directly in an index. Past performance does not guarantee future results. Latest available data as of 6/30/2025.
Tariff rates have declined since April, but are still elevated

Source: Goldman Sachs
Tariff timeline

Disclosures: WhiteHouse.gov. Blue = Exemptions, Pauses, and Agreements. Green = Completed Trade Deals. Yellow = End of Reciprocal Tariff Pause.
Valuations are high, but remain in the post-COVID range

Price-to-earnings is price divided by consensus analyst estimates of earnings per share for the next 12 months as provided by IBES since March 1994 and by FactSet since January 2022. Average P/E and standard deviations are calculated using 30 years of history. Shiller’s P/E uses trailing 10-years of inflation-adjusted earnings as reported by companies. Dividend yield is calculated as the next 12-months consensus dividend divided by most recent price. Price-to-book ratio is the price divided by book value per share. Price-to-cash flow is priced divided by NTM cash flow. EY minus Baa yield is the forward earnings yield (consensus analyst estimates of EPS over the next 12 months divided by price) minus the Moody’s Baa seasoned corporate bond yield. Std. dev. over-/under-valued is calculated using the average and standard deviation over 30 years for each measure. Data as of June 30, 2025.
Q2 volatility highlighted by April drop and historic rebound, market volatility continues to trend lower

Disclosures: Nasdaq. The performance of this index is provided for informational purposes only and does not represent an actual investment. Index performance is for illustrative purposes only and does not reflect any management fees, transaction costs or expenses. Indexes are unmanaged and one cannot invest directly in an index. Past performance does not guarantee future results. Latest available data as of 6/30/2025.
First quarter earnings surprised to the upside
S&P 500 earnings grew +12% and beat expectations in the first quarter, driven by the Magnificent 7 stocks. The average earnings surprise was +7.6% compared to +4% over the prior four quarters. As the second-quarter reporting season gets underway, we will be watching to see to what extent tariffs and policy uncertainty weighed on earnings in Q2, and if some of the Q1 growth will be attributed to demand being pulled forward ahead of tariffs taking effect.

Source: JP Morgan
Earnings estimates have only been revised down slightly, and the outlook for growth remains positive

Disclosures: The performance of this index is provided for informational purposes only and does not represent an actual investment. Index performance is for illustrative purposes only and does not reflect any management fees, transaction costs or expenses. Indexes are unmanaged and one cannot invest directly in an index. Past performance is no guarantee of future results. NTM = Next 12 month. S&P 500 Scenario Analysis Note: Growth of 0% (center column) is based on the current NTM consensus EPS of $280, which already implies more than +10% growth vs. trailing 12-month actual EPS. Therefore, growth of +10% (far right column) would imply over +22% growth vs. LTM actual EPS. The S&P 500’s NTM P/E multiple is currently 22x.
International outperformance remains a theme for 2025… less so in longer periods

Disclosures: Past performance is no guarantee of future results. All performance data represents price returns for the stated period. S&P 500: SPDR S&P 500 ETF Trust (SPY), Emerging Markets: iShares MSCI Emerging Markets ETF (EEM), Developed Markets: iShares MSCI EAFE ETF (EFA)
Similar story with recent US Dollar weakness: historical context is important

Disclosures: Monthly datapoints from the Federal Reserve. The U.S. Dollar Index is an index of the value of the United States dollar relative to a basket of foreign currencies, often referred to as a basket of U.S. trade partners’ currencies, including the Euro, Japanese Yen, British Pound, Canadian Dollar, Swedish Krona, and Swiss Franc.
Long end Treasury yields rose in Q2 while shorter term rates fell. We think the curve should steepen further from here.

Disclosures: Data based on latest available data sourced from Federal Reserve. The yield curve shows the relationship between interest rates and time-tomaturity.
The Fed path forward remains uncertain, but the likely
trend is clearly lower

Tariffs and trade policy uncertainty have also influenced Fed policy. The central bank faces a difficult policy tradeoff: tariffs could lead to higher inflation, but they could also slow economic growth if higher prices reduce demand for goods and services. Given the uncertainty, the Fed held interest rates steady at its May and June meetings, reiterating that it wants more data before deciding on interest rate cuts.
Disclosures: CME. The forward-looking interest rate expectations referenced herein are derived from futures market pricing. These implied expectations reflect market participants’ consensus view at a given point in time regarding the potential path of monetary policy. They are not the Federal Reserve’s forecast, and they are subject to change without notice. This material is provided for informational purposes only and should not be construed as investment advice or a recommendation to buy or sell any security or financial instrument. All investing involves risk, including the risk of loss. Past performance is not indicative of future results.
The upside of higher rates is that bonds are providing income…

Disclosures: Standard & Poor’s, Bloomberg. Index performance is for illustrative purposes only and does not reflect any management fees, transaction costs or expenses. Indexes are unmanaged and one cannot invest directly in an index. Past performance does not guarantee future results. Bonds represented by Bloomberg Barclays US Aggregate. Stocks represented by the S&P 500 Index. Time Period: June 2000 to June 2025. Latest available data as of 6/30/2025.
…and diversification

Disclosures: Past performance is no guarantee of future results. Correlation is calculated as the correlation of weekly price returns over the past rolling 6- month period. Stocks are represented by the State Street SPDR S&P 500 ETF (SPY) and bonds by the iShares Core U.S. Aggregate ETF (AGG). The long-term average is calculated as the average correlation over the past 15 years.
Inflation fell to the lowest in 3 years, but that positive news is countered by softer labor data and weak consumer confidence
| Category | Economic Datapoint |
|---|---|
| Labor | Nonfarm Payrolls (000s) Unemployment Rate (%) Average Workweek (Hours) Average Hourly Earnings (y/y%) Jobless Claims – Initial (000s) Jobless Claims – Continuing (Millions) Job Openings (Millions) |
| Consumer | Personal Income (y/y%) Retail Sales (y/y%) Domestic Auto Sales (y/y%) Consumer Confidence Index Michigan Confidence Index |
| Housing | New Home Sales (y/y%) Housing Starts (y/y%) Building Permits (y/y%) Homebuilder Sentiment Index Monthly Supply (# of months) National Home Price Index ($000s) |
| Business | Leading Economic Index (y/y%) NFIB Small Business Index Manufacturing PMI Services PMI Industrial Production (y/y%) Capacity Utilization (%) |
| Inflation | Headline CP| (y/y%) Core CP| (y/y%) Headline PCE (y/y%) Core PCE (y/y%) Producer Price Inflation (y/y%) |

Disclosures: Data sourced from Federal Reserve, NBER, Redbook, Institute for Supply Management, University of Michigan, DOL, U.S. Census Bureau, NAHB. Red = Worst (5th percentile). Green = Best (95th percentile)
Inflation approaching manageable long-term average…

Disclosures: Data sourced from the Federal Reserve, U.S. Bureau of Labor Statistics. The Consumer Price Index (CPI) measures the changes in the price level of a basket of consumer goods and services purchased by households. The Producer Price Index (PPI) measures the average changes in prices received by domestic producers for their output (based on Final Demand: Finished Goods Less Foods and Energy)
…yet consumer confidence remans well below long-term average

Disclosures: The University of Michigan Consumer Sentiment Index is a monthly survey that asks consumers questions about their financial standing and views on both the current and future economy.
Homeowners are aging, causing economic concern
Over the last 50 years, the average age of homebuyers in the U.S. has risen drastically as home ownership has shifted later in life and housing affordability has deteriorated.
Since 1980, the median age of all homebuyers has increased from 31 to over 55. Additionally, the first-time home buyer is struggling to enter the market as the median age of first-time buyers increased from 29 in 1980 to 38 in 2024. This has reflected some social/demographic shifts but also a shortage of lowerpriced home inventory and affordability concerns from higher mortgage rates.

Source: National Association of Realtors, 2024 Profile of Homebuyers and Sellers
U.S. recession odds are back to low, start-of-the-year levels
Bettors pushed the odds of a U.S. recession in 2025 as high as 66% early in the second quarter, but those odds have drastically fallen as tariff announcements have been digested and key legislation has resolved unknown questions about tax and fiscal policy.

Source: Polymarket, “US recession in 2025,” https://polymarket.com/event/us-recession-in-2025. Accessed July 8, 2025.
One Big Beautiful Bill Act Summary
The main focus of H.R. 1, the One Big Beautiful Bill Act (OBBBA), is an extension of the 2017 Tax Cuts and Jobs Act (Trump Tax Cuts), which were scheduled to sunset beginning January 1, 2026. Large parts of the extension will become permanent. The bill also contains provisions for increased border security, national defense, energy, and the debt ceiling. The bill is partially paid for by tougher new rules relating to Medicaid and other entitlement eligibility requirements, plus reductions in green energy subsidies that were passed as part of President Biden’s 2022 Inflation Reduction Act (IRA). Deficit spending provides the rest. The bill proceeded through the Budget Reconciliation process, which required only a majority of votes in the Senate, rather than the usual 60 votes needed to break a filibuster. The effective dates and implementation of the new rules are spread out over several years. Many of the provisions are even retroactive to the beginning of 2025. Almost all taxpayers will be affected in some way. We have summarized many of the details, organized by the year the provisions go into effect:
2025
- Permanent extension of current income tax brackets adjusted for inflation. In 2026 the lower three brackets get an extra year of upward inflation adjustment.
- Standard Deduction is increased to $15.75k for Singles and $31.5k for Joint filers and made permanent with annual inflation adjustments.
- Increase in the State and Local Tax (SALT) deduction from $10k to $40k for 2025. It goes up to $40.4k in 2026 and then 1% increases per year through 2029. The income phase-out begins at $250k AGI for Singles and $500k AGI for Joint filers, increasing 1% per year. The law would sunset on January 1, 2030 and return to the previous $10k limit. Current SALT workarounds like the PTET election remain in effect for anyone needing relief for SALT in excess of $40k.
- Qualified Small Business Stock (QSBS) exclusion increases from $10mm to $15mm indexed for inflation but is still subject to the 10x basis limitation rule. New holding periods for QSBS issued after OBBBA enactment include exclusions of 50% of gain if held for 3 years, 75% for 4 years, and 100% if held for 5 years. The gross asset limit increases to $75mm from the previous $50mm.
- The debt ceiling increases by $5t. Prior to passage, the debt limit was expected to be breached in August 2025.
- Permanent increase in the child tax credit from $2k to $2.2k per child adjusted for inflation. At least one parent must have a valid Social Security number.
- A “no tax on tips” provision eliminates Fed and State taxes (but not payroll taxes) on up to $25k of tip income per individual. An income phase-out for Singles begins at $150k and $300k for Joint filers. The rule sunsets on January 1, 2029.
- The first $12,500 of overtime pay is tax-deductible until January 1, 2029. Phase-outs begin at $150k for Singles and $300k for Joint filers.
- Seniors 65 and older receive an extra $6k deduction with phase-outs starting at $75k for Singles and $150k for Joint filers. This rule sunsets on January 1, 2029. One of President Trump’s campaign promises was to eliminate Social Security taxes on seniors. Legally, this cannot be passed through the Budget Reconciliation process, so this new tax deduction for seniors is effectively a workaround to accomplish that promise.
- Parents, relatives, etc. can contribute up to $5k in total per year to tax-deferred “Trump accounts” for children until they turn 18. Children born during 2025-2028 receive a $1k contribution into their “Trump accounts” from the federal government. Account owners aged 18-25 can take withdrawals up to 50% of the account value for “qualified expenses” including education, training, business loans, or a first home. Account owners aged 26-29 can withdraw remaining funds for these same expenses. At age 30, account owners can withdraw any remaining funds in the account for any reason. The gains from funds withdrawn for “qualified expenses” are taxed at capital gains rates, while any other withdrawals will be taxed as ordinary income. Distributions of principal are tax-free.
- Ability to deduct up to $10k per year in car loan interest for American-made new cars. An income phase-out begins at $100k for Singles and $200k for Joint filers. This deduction sunsets on January 1, 2029.
- Credits for energy-efficient home improvements sunset on January 1, 2026, and the $7.5k credit for EV purchases sunsets on October 1, 2025.
- The excise tax on non-profits with employees earning over $1mm is increased to cover all employees over the limit instead of the current cap of just five employees.
- 100% bonus depreciation is reestablished (currently 40%) and becomes permanent for equipment. The deduction for improvements to buildings and manufacturing plants lasts through 2028. The Section 179 deduction cap increases to $2.5mm from the current $1mm, with a phase-out starting at $4mm.
- The Research and Development credit is reestablished and becomes permanent.
- Depreciation and amortization have been added back in as part of the calculation for determining the business interest deduction, which should result in an increased deduction.
- The statute of limitations relating to Employee Retention Credits is extended to six years, and all claims filed after 2024 are automatically disallowed.
- Supplemental Nutrition Assistance Program (SNAP) work requirement goes up through age 64.
- Border Security increases include: $45b for detention facilities, $14b for deportation operations, hiring 10 thousand more agents by 2029, and $50b for new border fortifications/walls. This is partially funded through a new $100 fee for those seeking asylum.
2026
- Permanent lifetime estate and gift tax exemption increase to $15mm per individual, $30mm per married couple, adjusted for inflation. The current limit is $13.99mm per individual or $27.98mm per couple, so for those who have utilized all of their lifetime exemption, this will create opportunities for additional gifting in 2026 and future years.
- Opportunity Zones are made permanent with updated rules. New OZ census tracts can be nominated for designation and certification by Treasury starting July 1, 2026 in ten-year rolling increments and taking effect on January 1 following the date they were designated. Stricter standards for what constitutes a “low-income community” for these new OZs will reduce the number of available tracts for investment. Existing OZ’s could be redesignated under the new rules. Instead of having the same deferral date for all OZ investors as was the case under the old rules, there will now be a rolling 5-year deferral period beginning on the date of the initial investment in the OZ. This means that, starting January 1, 2027, investors will be able to defer eligible gains that are rolled into OZ investments for five years, regardless of what year they make the investment. If the taxpayer holds the OZ investment for at least five years, they will receive a 10% increase in the basis of the deferred gain, or a 30% increase in the basis if the investment is made in a Qualified Rural Opportunity Fund. Note that deferred gain invested before January 1, 2027, will still be recognized under the old rule on December 31, 2026. The forced December 31, 2047 exit date to receive the tax-free gain benefit under the OZ program is repealed for OZ investments made on or after January 1, 2027. For those investments held between 10 and 30 years, there will be no capital gains tax upon sale. For investments held longer than 30 years, any appreciation in value beyond the 30-year period would be subject to tax when the investment is sold.
- Permanent extension of 20% Qualified Business Income (QBI) deduction for pass-through entities. Additionally, the phasein limits are expanded from $50k to $75k for Singles and from $100k to $150k for Joint filers. Lastly, a new minimum $400 deduction is created for taxpayers with at least $1k of QBI as long as the taxpayer materially participates.
- Expansion of 529 Plan provisions: The K-12 tuition cap increases from $10k per year to $20k. Qualified expenses including books, online resources, curriculum, tutoring, educational therapies, home schooling courses and software, dual enrollment and standardized testing fees will apply to K-12 students instead of just college and graduate students. Tuition and materials for certificate programs, trade schools, and other credentialed programs will also be eligible.
- Low-income housing credit (LIHTC) is made permanent with a 12% increase in the annual state credit allocation for 9% LIHTC projects. Also, the bond-financing threshold for 4% LIHTC projects is reduced to 25% from the current 50% for projects issued from 2026 – 2029.
- REITS will be able to hold up to 25% of assets in qualified subsidiaries, up from the previous 20%.
- Obamacare bronze level plans and catastrophic health plans will be considered high-deductible plans, meaning they will be HSA compatible.
- $1,700 credit for taxpayers who donate to groups that provide scholarships for kids to attend private schools.
- Dependent care FSA cap increases to $7.5k from the current $5k.
- Child and dependent care expense credit increases to 50% from the current 35% along with a new phase-out schedule with a 20% floor.
- Farmers can spread their capital gains related to the sale of their farmland over four years.
- New 0.5% AGI threshold for deducting charitable contributions on Schedule A. Only the amount of contributions exceeding the new floor receives a deduction. This is analogous to the 7.5% AGI threshold for deducting medical expenses on Schedule A. Carryforward charitable contributions also face the 0.5% threshold in subsequent years. There is also a new 1% taxable income threshold for corporate charitable contributions.
- Non-itemizers will be able eligible for an above-the-line deduction for charitable contributions up to $1k for Singles and $2k for Joint filers as long as they are not made to DAFs or private foundations.
- $750k mortgage interest limitation is made permanent, but the private mortgage insurance (PMI) deduction comes back after having previously expired. Income limitations apply.
- The definition of “casualty losses” will expand to include state-declared disasters instead of just federally declared disasters.
- Permanent new effective cap of the itemized deduction percentage at 35% instead of 37%.
- Permanently extends AMT exemptions ($88.1k for Singles and $137k for Joint filers) with inflation adjustments. Phase-out levels decrease to $500k for Singles and $1mm for Joint filers, indexed for inflation (previously ~$626k for Singles and ~$1.25mm for Joint filers). Lastly, the phase-out is increased from 25% to 50% for amounts above the new limits. These will increase AMT exposure.
- Professional and amateur gamblers will be limited to deducting 90% of their losses against winnings, compared to the current rule of deducting all losses up to the extent of winnings. E.g., if you win $150k, but have $100k of losses, you will only be able to deduct $90k of losses and will owe taxes on $60k of gambling income.
- Student loan payment deferrals related to economic hardship are eliminated.
- Government student loan plans will have various caps starting in July 2026.
- Coal will be classified as a “critical mineral” and can receive government manufacturing credits when used during the steelmaking process.
- The Endowment Tax on net investment income of private college and university endowments rises from 1.4% up to 8% depending on the amount of endowment assets per student. $500k-$750k per student generates a 1.4% tax; $750k-$2mm per student generates a 4% tax; $2mm+ per student generates an 8% tax.
- Investment credit for semiconductor manufacturers increases from 25% to 35% if they break ground on new facilities by December 31, 2026.
- Consumer Financial Protection Bureau funding cap cut in half to ~6.5%
2027
- Work requirements begin for Medicaid recipients aged 19-64 unless they have children under 14, are pregnant, or have medical conditions. They must work, enroll in school or job training at least half-time, or volunteer at least 80 hours per month. Verification will increase to twice per year. Illegal immigrants will also face restrictions on benefits. A $50b fund for rural hospitals will be established.
- Elimination of solar and wind credits for any project not completed by December 31, 2027. Previously a project only needed to have started by that date.
2028
- Cap on Medicaid provider taxes will affect 40 states that expanded Medicaid under Obamacare.
- States will be required to contribute a set percentage of SNAP costs if their error rate exceeds 6%. Alaska and Hawaii receive a two-year extension to begin implementing this rule.
Pork Barrel Spending
Just for fun, we wanted to highlight some of our favorite carve-outs in the bill:
- Texas Senators Ted Cruz and John Cornyn managed to get the retired space shuttle Discovery moved to Houston from its current Smithsonian National Air and Space Museum in Washington, DC. This includes $85mm to cover the relocation costs.
- The whaling expense deduction increases from $10k to $50k at the request of Alaska Senator Lisa Murkowski.
- Senator Murkowski also got another special deduction for business meals that will apply to Alaskan fishing boats and processing plants. The language says the new law only applies to businesses located in the USA, north of 50 degrees north latitude, and not in a major city. Alaska is the only state that qualifies.
- Louisiana Senator Bill Cassidy helped his state get a $2b tax break for the rum industry.
- Senator James Lankford from Oklahoma slipped in a provision to exempt oil and gas companies from the 15% minimum tax on big corporations created by President Biden.
- A gift benefiting Elon Musk and Jeff Bezos allows any company with a spaceport facility to sell tax-exempt bonds.
Disclosures
Past performance is not indicative of future results. Sage Mountain Advisors, LLC (“SMA”) is an independent SEC registered investment advisor. Any reference to or use of the terms “registered investment adviser” or “registered,” does not imply that SMA or any person associated with SMA has achieved a certain level of skill or training. This material is provided for informational and educational purposes only.
Any subsequent, direct communication by SMA with a prospective client shall be conducted by a representative that is either registered or qualifies for an exemption or exclusion from registration in the state where the prospective client resides. For more information pertaining to the registration status of SMA, please contact SMA or refer to the Investment Adviser Public Disclosure website (www.adviserinfo.sec.gov). The information contained herein should not be construed as personalized investment, tax, or legal advice. Certain information contained in this presentation has been derived from third party sources. While we believe these sources to be reliable, we make no representations as to the accuracy, timeliness, and completeness of any such information prepared by any unaffiliated third party incorporated herein, and take no responsibility therefore. As such, there is no guarantee that the views and opinions expressed in this presentation will come to pass.
All investments carry a certain degree of risk of loss, and there is no assurance that an investment will provide positive performance over any period of time. The statements contained herein reflect opinions, estimates and projections of SMA as of the date hereof, and are subject to change without notice. SMA reserves the right to modify its current investment strategies and techniques based on changing market dynamics or individual portfolio needs. The opinions expressed herein are those of SMA and are subject to change without notice. Information presented should not be considered as a solicitation or recommendation to buy or sell any security, financial product, or instrument discussed herein. Additionally, this material contains certain forward-looking statements which point to future possibilities. Due to known and unknown risks, other uncertainties and factors, actual results may differ materially from the results portrayed or implied in such forward-looking statements. Furthermore, the illustrative results presented in this presentation in no way reflect the performance of any SMA product or any account of any SMA client, which may vary materially from the results portrayed for various reasons, including but not limited to, investment objectives, financial situations and financial needs of SMA clients; differences in products and investment strategies offered by SMA; and other factors relevant to the management of SMA client accounts.
This presentation and its contents are provided “as is” without warranty of any kind, express or implied, including, but not limited to, implied warranties of merchantability, fitness for a particular purpose, title, non-infringement, security, or accuracy. SMA reserves the right to modify its current investment strategies and techniques based on changing market dynamics or client needs. It should not be assumed that any of the security transactions, holdings or sectors discussed were or will prove to be profitable, or that the investment recommendations or decisions we make in the future will be profitable or will equal the investment performance of the securities discussed herein.
Actual investment advisory fees incurred by clients may vary. A complete description of SMA’s fee schedule can be found in Part 2 of its FORM-ADV which is available at www.sagemountainadvisors.com or by calling (404) 795-4861. Clients are advised that no portion of the services provided by SMA should be interpreted as legal, tax or accounting advice. For legal and tax-related matters, we recommend that you seek the advice of a qualified attorney, accountant or tax professional. SMA-25-0206