SAGE MOUNTAIN 945 East Paces Ferry Rd NE, Suite 2660, Atlanta, GA 30326
Sage Mountain Research
Market Update – Q3 2022
The story of 2022 is the rapid increase in interest rates—far beyond what was expected coming into the year.
Stubbornly high inflation has caused the Fed to raise rates much faster than expected. Market expectations for the March 2023 Fed Funds rate has increased from 1.3% in January to 5% today. The lag in shelter inflation will likely keep Core CPI artificially elevated through year end before decelerating further in early 2023. In our view, the Fed will maintain a hawkish stance at least through year end, but it will face significant pressure to ease next year if unemployment rises and inflation normalizes as we expect (and which the Fed’s own projections forecast as well).
Nearly all asset classes have struggled, while alternatives have provided some much-needed diversification beyond the traditional 60/40 portfolio.
Our recommendations to shorten duration in fixed income, overweight US vs. international equities, and diversify into alternative asset classes have added value this year, and we continue to maintain those stances.
While there is comfort in reducing equity exposure in difficult markets, the difficulty in timing the market creates a very high bar to do so. We recommend clients maintain their strategic allocations while seeking tactical opportunities to rebalance, harvest tax losses, and take advantage of potential opportunities created by market distress (e.g. secondaries funds, better terms for private lenders, and sectors like biotech and enterprise software).

Fixed income is down due to a sharp increase in interest rates.
Equities have struggled as higher rates have weighed on valuations. Commodity prices have cooled after a strong first half.
Alternative assets like private equity and real estate have had positive returns, although with potentially stale data.
The US Dollar has shown remarkable strength vs. other currencies.
Although the 60% equity / 40% bond portfolio is on track for one of its worst years in recent memory (-20% in 2008), it has still returned 8.5% per year over the past 10 years.
There has been carnage in bond markets, but shortening duration has limited the downside

Our clients benefitted from the tactical decision to allocate a majority of their investment grade fixed income to SPACs (-0.12% return year to date) and the Angel Oak UltraShort Income Fund (-2.90% year to date).
Given the increase in interest rates, we are now recommending a rotation into municipal bonds to take advantage of higher yields. Because rates on short term bonds are similar to rates on bonds with longer maturities, we recommend targeting a short duration portfolio which minimizes interest rate risk without sacrificing yield.
2022 Has been a terrible year for bonds, especially as the major bond indexes have significant duration (interest rate) risk.
Sage Mountain has recommended shorter duration fixed income that seeks to generate return while limiting interest rate risk. Longer duration benchmarks have experienced significant declines. The Bloomberg US Aggregate has returned -14.61% this year and the Bloomberg Muni 1-10 Year Blend has returned -7.72%. Even the shorter duration Vanguard Short-Term Treasury ETF (VGSH) has returned -4.51%.
Credit spreads have widened, but are still well below levels seen during the COVID crisis

After peaking just below 6% (vs. 11% in March 2020), high yield credit spreads have declined to 5.5%. Defaults have remained low at 1.1% over the past 12 months vs. the long-run average of 3.6%. per J.P. Morgan. We believe this has created attractive opportunities to invest in credit, but still prefer direct lending and private credit where interest rate exposure is low, we have identified managers with a demonstrated ability to minimize defaults, and lenders may have the ability to negotiate more favorable terms.
The relative strength of US equities has continued…

After a period of relative underperformance from 2002-2007, US equities have outperformed international in 12 of the 15 years since the 2008 Financial Crisis. We have consistently recommended an overweight to US equities and maintain our recommendation to target a ratio of 80% US to 20% international stocks vs. the global market cap weight of 62% US to 38% international.
…driven by the strength of the US dollar

US dollar (USD) denominated returns of international equities are a combination of the equity return and the change in the exchange rate vs. the USD. Periods of international outperformance (e.g. 1983- 1988 and 2002-2007) have generally coincided with a weakening USD which provided a boost to international returns when translated back to USD.
This year the currency impact has detracted about 13% from international returns. While it is possible to hedge the currency exposure, we do not recommend doing so as that removes a source of diversification which is one of the key reasons to invest in international equities.
Implied yields of 3-Month Eurodollar futures—a proxy for the expected Fed Funds Rate— have increased significantly…

The chart below shows current expected rates compared to January 3, August 25 (prior to Fed Chair Powell’s speech in Jackson Hole), and September 20 (prior to the most recent Fed meeting). Markets are now pricing a peak rate of 4.7% in March 2023 (vs. 4% prior to Jackson Hole) declining to 4% by the end of 2024 (vs. 3.1% prior to Jackson Hole and 3.7% prior to the September Fed meeting). The current target rate is 3% to 3.25%.
…which has been reflected in tightening financial conditions
")
Financial conditions help to measure the impact of Fed policy on the real economy. Easing financial conditions— reflected in a lower FCI level—generally stimulate demand while tightening conditions—reflected in a higher FCI level—generally decrease demand throughout the economy.
There are encouraging signs that inflation has finally reached a turning point

The current inflation trend explains the Fed’s aggressive approach – whether monthly or year over year. Core inflation has likely peaked, but has not shown a consistent deceleration (yet).
There are key differences versus last year:
- Energy prices have rolled over and will feed into broader prices.
- Government deficits are far lower and thus less fiscal stimulus is in the pipe.
- The Fed has been hiking rates aggressively and this should begin to show results.
- We believe the spike in mortgage rates will reduce shelter inflation—which accounts for 40% of Core CPI— but with a lag.
Housing inflation lags market prices
")
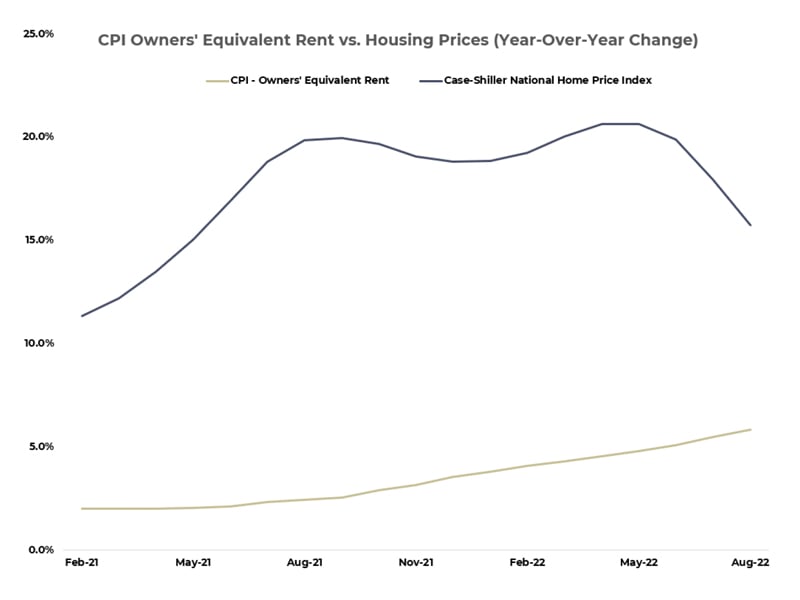
Source: FRED, Zillow, S&P Global
CPI measures of shelter (i.e. housing) are based on average rents which tend to lag market prices by about a year as rents are typically set by long-term leases. The graphs above show that CPI has lagged market measures of rent and home prices on the way up, and are still showing an accelerating pace of inflation while increases in current market prices have already started to cool after peaking in February. This means that the shelter portion of CPI (about 33% of Headline CPI and 40% of Core) will likely remain elevated for several more months, potentially peaking in early 2023. That will likely keep the Fed in tightening mode through year end, but could give them leeway to stop hiking or even cut rates early next year.
Real hourly wages are not inflationary

Some economists are focused on the possibility of a “wage- price spiral” where a rise in one results in an increase in the other.
The government’s own data shows that real wages are flat to down, as prices have outpaced wage gains. This is even before the lagged impact of tighter monetary policy on the unemployment rate.
If consumers are making less and are worried about the economy, they will likely retrench spending – signs of which we have already seen in retailers’ earnings. Thus, companies will have trouble continuing to push prices higher.
The labor market remains strong…

While payroll growth has slowed since the post-lockdown rebound, it has remained strong so far this year. The US has added 3.5 million jobs through August, an average of 438k jobs per month. The average over the past 3 and 6 months has been 378k and 381k, respectively, so growth has only slowed modestly over the past several months. Job openings are at historically high levels, a potential indicator that robust payroll growth will continue.
…with initial jobless claims declining after a mid- summer increase

Initial jobless claims provide an additional measure of labor market conditions and can provide more real time information than the monthly employment reports since they are measured weekly. Claims rose from 220k in early January to 250k in early August, a potential warning sign of impending softness in the job market. Instead, they have since declined again to the lowest levels since April.
Strategists have lowered their S&P 500 targets, but still predict upside from current levels

Strategists’ average year end S&P 500 price target is 4,273, down from 4,982 coming into the year.
If the S&P 500 ended the year at that level, excluding dividends that would be a -10% return for the year and a 19% increase from the current close of 3,586 (as of Sept. 30).
Earnings forecasts have also been revised lower, but valuations have normalized

Consensus earnings for 2022 are 224 per share vs. 231 at the beginning of the year. It is common to see earnings forecasts downgraded over time, so we expect that will drop further as Q3 earnings are announced and forward guidance is updated.
The P/E ratio based on trailing 12 months earnings of 221 is 16.3x vs. 22.9x as of year end 2021. Based on estimated forward 12 months earnings of 237, the P/E ratio is 15.1x vs. 20.6x as of year end 2021. The 25-year average forward P/E ratio is 16.8x, indicating that US equities are now trading below historical average valuations.
Consensus earnings for 2023 are 242. That would represent an 8% increase from expected full year 2022 earnings, although we believe that earnings expectations for both years will be revised lower
based on historical trends.
Over shorter time periods, investing can feel turbulent…

While returns over 1 year periods vary widely, the variance over longer periods such as 5 and 10 years is much lower. The worst one year period for a 60% US Stock / 40% US Bond portfolio saw a return of -44.6%, but over nearly 100 years of history the worst 10 year annualized return for the same portfolio is +0.04%.
Markets can be very volatile in the short-term, but investors benefit from maintaining a longer-term perspective.
…but market timing can be a significant risk
The chart below shows the return of a $10,000 investment in the S&P 500 over the past 20 years vs. returns impacted by missing some of the best days in the market. As of year-end 2021, seven of the best days have occurred within two weeks of their corresponding worst day. Thus, the impulse to sell right after a big drop is likely harmful to long term returns.

Selling out “until things look better” does not work because:
- There is no reliable signal to get out, and emotion can be powerful as humans suffer from risk aversion.
- There is no reliable “all clear” signal to get back in. A pre- determined target price to buy can remove some of the emotion, but if the market doesn’t drop enough to trigger the purchase you will miss any subsequent recovery and may end up buying back in at a higher price than where you sold.
- If selling triggers gains for taxable investors, the hurdle to overcome is even higher to offset the additional taxes.

Russ Allen
Director of Investment Strategy
Sage Mountain
Tony Cox
President & Chief Investment Officer
Sage MountainDisclosures
Past performance is not indicative of future results. Sage Mountain Advisors, LLC (“SMA”) is an independent SEC-registered investment advisor. Any reference to or use of the terms “registered investment adviser” or “registered,” does not imply that SMA or any person associated with SMA has achieved a certain level of skill or training. This material is provided for informational and educational purposes only.
Any subsequent, direct communication by SMA with a prospective client shall be conducted by a representative that is either registered or qualifies for an exemption or exclusion from registration in the state where the prospective client resides. For more information pertaining to the registration status of SMA, please contact SMA or refer to the Investment Adviser Public Disclosure website (www.adviserinfo.sec.gov). The information contained herein should not be construed as personalized investment, tax, or legal advice. Certain information contained in this presentation has been derived from third-party sources. While we believe these sources to be reliable, we make no representations as to the accuracy, timeliness, and completeness of any such information prepared by any unaffiliated third party incorporated herein, and take no responsibility therefore. As such, there is no guarantee that the views and opinions expressed in this presentation will come to pass.
All investments carry a certain degree of risk of loss, and there is no assurance that an investment will provide positive performance over any period of time. The statements contained herein reflect opinions, estimates, and projections of SMA as of the date hereof, and are subject to change without notice. SMA reserves the right to modify its
current investment strategies and techniques based on changing market dynamics or individual portfolio needs. The opinions expressed herein are those of SMA and are subject to change without notice. Information presented should not be considered as a solicitation or recommendation to buy or sell any security, financial product, or instrument discussed herein. Additionally, this material contains certain forward-looking statements which point to future possibilities. Due to known and unknown risks, other uncertainties, and factors, actual results may differ materially from the results portrayed or implied in such forward-looking statements. Furthermore, the illustrative results presented in this presentation in no way reflect the performance of any SMA product or any account of any SMA client, which may vary materially from the results portrayed for various reasons, including but not limited to, investment objectives, financial situations and financial needs of SMA clients; differences in products and investment strategies offered by SMA; and other factors relevant to the management of SMA client accounts.
This presentation and its contents are provided “as is” without warranty of any kind, express or implied, including, but not limited to, implied warranties of merchantability, fitness for a particular purpose, title, non-infringement, security, or accuracy. SMA reserves the right to modify its current investment strategies and techniques based on changing market dynamics or client needs. It should not be assumed that any of the security transactions, holdings, or sectors discussed were or will prove to be profitable, or that the investment recommendations or decisions we make in the future will be profitable or will equal the investment performance of the securities discussed herein.
Actual investment advisory fees incurred by clients may vary. A complete description of SMA’s fee schedule can be found in Part 2 of its FORM-ADV which is available at www.sagemountainadvisors.com or by calling (404) 795-4861. Clients are advised that no portion of the services provided by SMA should be interpreted as legal, tax or accounting advice. For legal and tax-related matters, we recommend that you seek the advice of a qualified attorney, accountant, or tax professional. SMA-22-000470