SAGE MOUNTAIN 945 East Paces Ferry Rd NE, Suite 2660, Atlanta, GA 30326
Sage Mountain Research
Q3 2025 Market Update
Q3 recap: back to our regular scheduled bull market…
Markets extended their robust Q2 performance into Q3, with the S&P 500, Nasdaq, and small-cap stocks all reaching fresh highs. Despite softer labor market readings and conflicting economic indicators, investor sentiment stayed positive, buoyed by solid corporate earnings, the Federal Reserve’s shift toward rate cuts, and diminishing trade tensions.
The quarter began with solid momentum. Economic activity had rebounded from earlier tariff-related disruptions, while new data suggested steady demand from both consumers and businesses. Job creation was healthy, consumer spending held firm, and business surveys indicated improving confidence. Stock markets climbed in July, reflecting optimism that the economy could weather elevated interest rates and trade uncertainty without falling into recession.
However, labor market weaknesses surfaced by late summer. Job growth decelerated notably beginning in May, with July and August delivering two consecutive months of disappointing gains alongside downward revisions to earlier figures. The unemployment rate climbed to 4.3%—its highest level since 2021. Though these labor trends sparked concerns about economic deceleration, other data confirmed that consumer spending remained resilient. The economy continued to expand, albeit at a slower pace.
The Federal Reserve maintained interest rates at its late-July meeting, pointing to a resilient labor market and persistent inflation concerns. That outlook shifted abruptly two days later following a weaker-thanexpected July jobs report. Several weeks later at Jackson Hole, Fed Chair Jerome Powell set the stage for a September rate reduction. He acknowledged that monetary policy seemed restrictive and suggested deteriorating labor market conditions could warrant a cut, even with inflation remaining above the Fed’s target. Powell’s comments solidified expectations for a September cut and signaled a decisive pivot from combating inflation to supporting employment.
The Fed delivered the anticipated -0.25% rate cut in September, concluding its 9-month holding pattern. Markets initially rallied on the news, with stocks surging to record levels and interest-rate-sensitive sectors leading gains. But enthusiasm waned in late September after a series of unexpectedly strong economic data suggested the economy might require fewer rate reductions than previously thought.
New home sales jumped significantly, second-quarter GDP growth was revised upward, and consumer spending proved durable. These reports prompted investors to scale back their rate cut projections, and by quarter-end, markets were pricing in a more gradual cutting cycle through 2025 and 2026.
Our Outlook for 4th Quarter 2025
Overall, the outlook for stocks, corporate credit, and prudently chosen private investments is positive. Markets have an optimistic tone, fueled by expectations for strong earnings growth, moderating but solid consumer spending, and ongoing Fed rate cuts. While economic growth has slowed this year and the labor market has softened, the slowdown has been a cooling rather than a collapse. Between consumer spending and AI capex, the economy is very likely to avoid recession, and thus major correction risk is presently normal to low. The prospect of additional rate cuts over the next year has reinforced expectations for a soft landing, fueling a “buy risk assets” narrative across stocks and bonds.
Stock prices reflect cooling but steady demand, contained inflation, and the belief that a major trade war will be averted. Corporate earnings have proven resilient, and growth is forecasted to remain strong. The market’s confidence rests heavily on AI-driven capex and tech leadership, with the AI infrastructure theme expected to fuel continued growth and stock market gains. Investors are willing to pay a valuation premium for the growth, and forward P/E multiples sit above historical averages. While we agree valuations are high, endless studies have shown valuation has no relationship to returns one year out. We also recognize that the S&P is highly concentrated, AI bubble-like behaviors exist, and there are some unique political/geopolitical concerns, and we are evaluating potential options to hedge equity risk but are currently recommending staying at target weights within equities.
The bond market prices in the same soft-landing outlook. The Treasury yield curve is steepening, with front-end rates falling on expectations of additional Fed cuts, while longer-term yields remain anchored due to concerns about fiscal deficits and inflation. The intermediate portion of the curve softened, perhaps reflecting a slower economy after the current fiscal stimulus driven cycle abates. Despite tight corporate credit spreads, investors continue to reach for yield, signaling low credit risk and further confidence in a soft landing. Because so much good news is priced in, we are wary of loans to weaker borrowers or with economically-sensitive collateral backing the investment, be it lending or real estate.
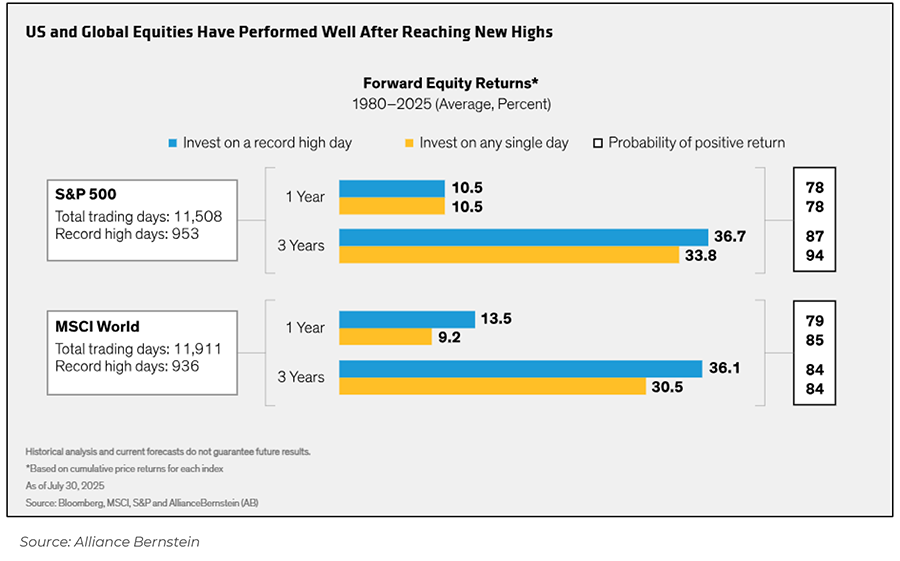
Market Highs are Usually Bullish
Investors are understandably concerned about the U.S. stock market’s high valuation (by longer term historical standards). Regarding this we make three points we have made before:
- Earnings growth has largely matched share price growth in U.S. markets, driven by continued margin expansion.
- The market is often at new highs, because the economy and earnings tend to grow over time. New highs are simply often followed by new highs, as the data in the chart shows.
- Valuation has no correlation with one-year future returns, but it does with longer time frames.
What We are Watching for Q4
- The Government shutdown – This is likely a non-event for the financial markets. The longest previous stoppage was just over a month. Current rumblings are already surfacing about restoring some ACA stopgap funding as a compromise.
- The Fed – The market remains extremely focused on interest rates. The Fed now believes it has been too tight and has begun cutting because of labor market weakness. Most analysts think there is neither significant hiring nor firing occurring, creating a “frozen” labor market that is mainly hurting new graduates. Inflation pressure is reduced but still evident; a nonadministration controlled Fed probably won’t cut deeply. It is a risk that the White House takes de facto control of the Fed and drives rates much lower even in the fact of moderate inflation. The market forecasts two more cuts by year-end, though this outlook could shift if inflation reaccelerates or the labor market stabilizes. In that sense, Q4 is set up to be avery datadependent quarter, with jobs, inflation, and consumer spending data all impacting the market and economic outlook.
- Tariff rhetoric resurfaces – The administration recently put tariffs on pharmaceuticals, heavyduty trucks, and housing products. The market is used to the uncertainty and still thinks compromise will be found if the financial pain becomes too great.
- Corporate earnings – Earnings have proven surprisingly resilient this year, and so far estimates continue to rise. The Q3 earnings season begins in mid-October, and management guidance will be key as companies update investors on the impact of tariffs and their 2026 outlooks. Earnings growth is expected to remain positive in Q4, though the pace may moderate.
- AI-related capital investment theme – Companies are reporting unfilled orders stretching into 2026 and capex plans measuring in the hundreds of billions, reinforcing the view that AI will be a multi-year investment cycle. However, valuations for AI companies are expensive, and much of the backlogs and spending plans are widely known and already reflected in stock prices. An earnings disappointment or skepticism around AI’s economics could weigh on the technology sector’s leadership and, by extension, the broader equity market.
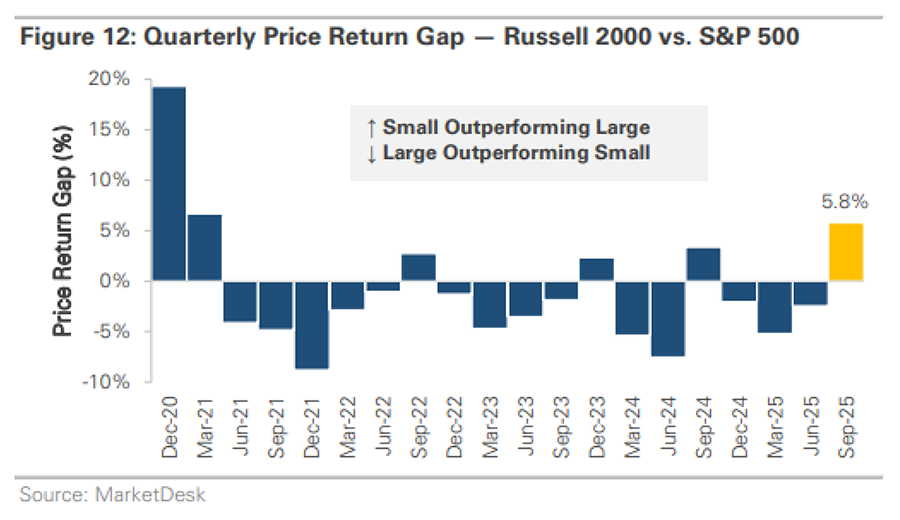
Comments on Positioning – Small Caps
Following many quarters of underperformance, smaller capitalization stocks finally outperformed in the third quarter. Due to the importance of the AI and large growth themes, we have not, and still do not see a reason to create a dedicated small cap position. Instead, we prefer to simply own the total market, plus a quality factor tilt.
On one hand, Small cap stocks are arguably unloved and underowned. If the Fed embarks on a more aggressive rate cutting cycle, this should be relatively more positive for small caps. On the other hand, the earnings growth picture still favors large cap growth. If the economy holds up well, as we expect, the rate cutting cycle may be shallower than the market expects. In turn this would still favor large caps.
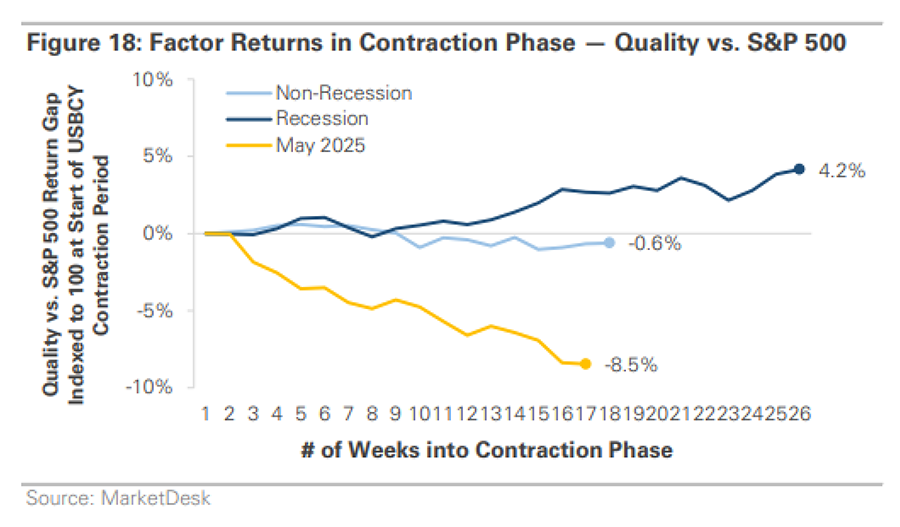
Comments on Positioning – Quality
We continue to maintain a quality factor tilt to accompany our total market expsoure. We maintain this factor exposure for both the U.S. and international equity positions. Quality has underperformed this year because of realtively higher exposure to more stable, defensive businesses, such as many in the Health Care sector. Lower risk stocks have significantly underperformed more aggressive, higher beta stocks, which explains a lot of this underperformance. We maintain our focus on Quality because it performs well during weaker periods in the market. The chart below shows how it often outperforms during recessions. The chart also shows how large, and unusual, the Quality factor underperformance was in May, when tariff fears significantly abated.
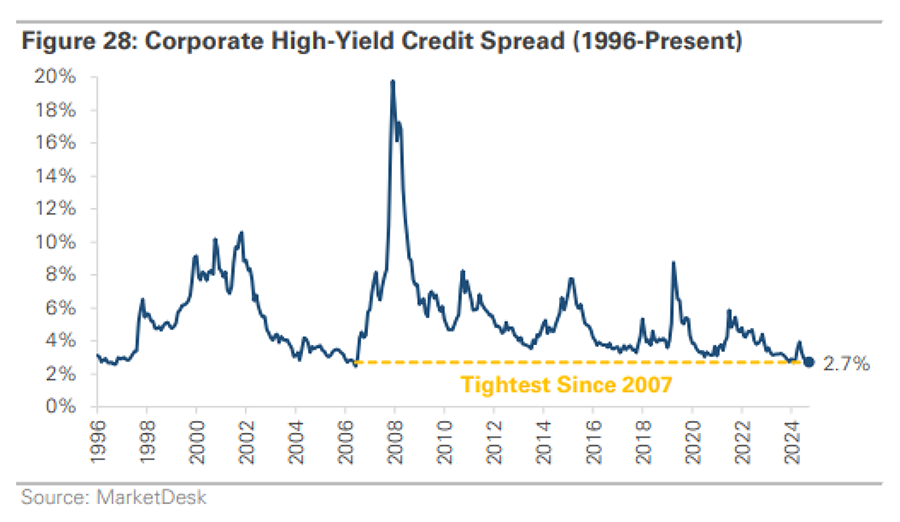
Comments on Positioning – Credit
While the front end of the Treasury yield curve still offers attractive yields, Fed cuts will reset them lower. Falling rates resulted in most floating rate debt underperforming in Q3. We see better opportunities in intermediate duration. Further out, long-duration Treasuries provide the strongest hedge against an economic slowdown but could perform poorly if the inflation picks up or if the bond market begins to worry about the level of deficit spending.
The chart below shows how high yield credit spreads are very tight. This makes riskier credit bonds and loans more vulnerable to macro shocks. Because the underlying economy appears healthy, we recommend a balance of higher yielding, riskier credit coupled with low-risk Municipal bonds or Treasuries.
Market Snapshot

Broad fixed income gained in Q3, as bonds benefited from rate cut outlook, improved investor sentiment, and duration shifts.
Stocks reached new highs in Q3, boosted by the Fed’s rate cut, strong earnings, and AI enthusiasm. Growth/Tech stocks again led the market but were outpaced by Small caps which returned +12.4% for the quarter.
In local currency terms, US equities have now overcome the gap with international markets, outpacing them year-to-date +14.8% to +13.6%. Continued US dollar weakness for the year however has propelled international and emerging markets stocks over +25%.
A 60% equity / 40% bond portfolio rose +5.7% in Q3, bringing its year-to-date performance to +11.4%.
Key headlines from the past quarter

Disclosures: Standard & Poor’s. The performance of this index is provided for informational purposes only and does not represent an actual investment. Index performance is for illustrative purposes only and does not reflect any management fees, transaction costs or expenses. Indexes are unmanaged and one cannot invest directly in an index. Past performance does not guarantee future results. Latest available data as of 9/30/2025.
Inflation moderates, but labor data is carrying the weight of investor worry
| Category | Economic Datapoint |
|---|---|
| Labor | Nonfarm Payrolls (000s) Unemployment Rate (%) Average Workweek (Hours) Average Hourly Earnings (y/y%) Jobless Claims – Initial (000s) Jobless Claims – Continuing (Millions) Job Openings (Millions) |
| Consumer | Personal Income (y/y%) Retail Sales (y/y%) Domestic Auto Sales (y/y%) Consumer Confidence Index Michigan Confidence Index |
| Housing | New Home Sales (y/y%) Housing Starts (y/y%) Building Permits (y/y%) Homebuilder Sentiment Index Monthly Supply (# of months) National Home Price Index ($000s) |
| Business | Leading Economic Index (y/y%) NFIB Small Business Index Manufacturing PMI Services PMI Industrial Production (y/y%) Capacity Utilization (%) |
| Inflation | Headline CP| (y/y%) Core CP| (y/y%) Headline PCE (y/y%) Core PCE (y/y%) Producer Price Inflation (y/y%) |

Disclosures: Data sourced from Federal Reserve, NBER, Redbook, Institute for Supply Management, University of Michigan, DOL, U.S. Census Bureau, NAHB. Red = Worst (5th percentile). Green = Best (95th percentile)
Is there a new “target” inflation?

Disclosures: Data sourced from the Federal Reserve, U.S. Bureau of Labor Statistics. The Consumer Price Index (CPI) measures the changes in the price level of a basket of consumer goods and services purchased by households. The Producer Price Index (PPI) measures the average changes in prices received by domestic producers for their output (based on Final Demand: Finished Goods Less Foods and Energy)
US Dollar has seen recent weakness, but historical context is key

Disclosures: Monthly datapoints from the Federal Reserve. The U.S. Dollar Index is an index of the value of the United States dollar relative to a basket of foreign currencies, often referred to as a basket of U.S. trade partners’ currencies, including the Euro, Japanese Yen, British Pound, Canadian Dollar, Swedish Krona, and Swiss Franc.
Consumer confidence reverses course following a rise early in the year and is still well below historical averages

Disclosures: The University of Michigan Consumer Sentiment Index is a monthly survey that asks consumers questions about their financial standing and views on both the current and future economy.
Valuations remain elevated, but can earnings growth support them?

Price-to-earnings is price divided by consensus analyst estimates of earnings per share for the next 12 months as provided by IBES since March 1994 and by FactSet since January 2022. Average P/E and standard deviations are calculated using 30 years of history. Shiller’s P/E uses trailing 10-years of inflation-adjusted earnings as reported by companies. Dividend yield is calculated as the next 12-months consensus dividend divided by most recent price. Price-to-book ratio is the price divided by book value per share. Price-to-cash flow is priced divided by NTM cash flow. EY minus Baa yield is the forward earnings yield (consensus analyst estimates of EPS over the next 12 months divided by price) minus the Moody’s Baa seasoned corporate bond yield. Std. dev. over-/under-valued is calculated using the average and standard deviation over 30 years for each measure. Data as of June 30, 2025.
U.S. Companies Continue to Beat Expectations
U.S. corporate earnings have remained surprisingly resilient despite tariffs and rising policy uncertainty. Over the past five years, an average of 78% of companies beat expectations each quarter. The percentage of companies beating earnings was highest in 2020 and 2021 as the economy reopened following the pandemic and expectations remained low. Despite macroeconomic challenges ranging from aggressive Fed rate hikes and to trade policy uncertainty, companies have consistently managed to outperform expectations

Disclosures: The earnings estimates, projections, and other forward-looking statements referenced in this presentation are based on third-party consensus data obtained from sources believed to be reliable. Consensus estimates are inherently uncertain and subject to change at any time, often without notice, as analysts update their assumptions and new information becomes available. Actual company results may differ materially from consensus expectations due to a variety of factors, including but not limited to changes in economic conditions, industry dynamics, company-specific developments, and broader market events. This material is provided for informational purposes only and should not be construed as investment advice or a recommendation to buy, sell, or hold any security. Past performance is not indicative of future results. Latest available data as of 9/30/2025.
Putting the AI-Capex Boom into Perspective

Disclosures: U.S. Bureau of Economic Analysis. Data represents the year-over-year growth rate of private investment in information processing equipment and software (Q1 1996 to Q2 2025). The performance data presented for the “Magnificent Seven” represents a group of widely followed large-cap U.S. technologyoriented stocks (Alphabet, Amazon, Apple, Meta Platforms, Microsoft, Nvidia, and Tesla). This grouping is not an official index and does not represent a recognized benchmark. Performance calculations are based on publicly available stock price data and may not reflect dividends, fees, or transaction costs unless otherwise noted. Past performance does not guarantee future results. Latest available data as of 9/30/2025.
But is this “Boom” or “Bubble”?

Source: J.P. Morgan Asset Management; (Left) Bloomberg; (Right) Census Business Trends and Outlook Survey (AI Supplement).
Data for 2025, 2026, and 2027 reflect consensus estimates. Capex shown is company total, except for Amazon, which reflects an estimate for AWS spend (2004 to 2012 are J.P Morgan Asset Management estimates and 2012 to current are Bloomberg consensus estimates). *Hyperscalers are the large cloud computing companies that own and operate data centers with horizontally linked servers that, along with cooling and data storage capabilities, enable them to house and operate AI workloads. **Reflects cash flow before capital expenditures in contrast to free cash flow, which subtracts out capital expenditures. Data as of 9/30/2025
Small caps rallied, but Large caps remain dominant

Disclosures: Past performance is no guarantee of future results. Performance is indexed to $10,000 three years ago. Valuations are based on the next 12-month price to earnings multiple. Large Caps are represented by the State Street S&P 500 ETF (SPY). Small Caps are represented by the iShares Russell 2000 ETF (IWM).
History of Market Drawdowns by Year

Disclosures: Past performance is no guarantee of future results. For illustrative purposes only. All performance data represents price returns and does not include dividends for the stated period. Drawdown is calculated from the intra-year peak to trough levels. Analysis is based on the State Street SPDR S&P 500 ETF (SPY).
Interest rates fluctuated in Q3 but ended lower, outlook for future Fed rate cuts remains

Disclosures: Data based on latest available data sourced from Federal Reserve. The yield curve shows the relationship between interest rates and time-tomaturity.
Importance of Diversification

Disclosures: Past performance is no guarantee of future results. Performance is for illustrative purposes only. Diversification does not guarantee a profit or protect against a loss in a declining market. Diversified Portfolio is represented by 40% Large Caps (SPY – SPDR S&P 500 ETF), 10% Developed Markets (EFA – iShares MSCI EAFE ETF), 5% Small Caps (IWM – iShares Russell 2000 ETF), 30% Bonds (AGG – iShares U.S. Aggregate Bond ETF), 10% High Yield (HYG – U.S. Corporate High Yield Bond ETF), and 5% Emerging Markets (EEM – iShares MSCI Emerging Markets ETF). Standard deviation is a measure of the amount of variation of each portfolio.
Key Themes to Watch the Next Six Months

Disclosures: Forward-looking statements are based on current expectations, estimates, projections, and assumptions. These statements involve risks and uncertainties, and actual outcomes may differ materially from what is expressed or implied. Forward-looking statements are not guarantees of future performance and should not be relied upon as such. Economic and market conditions are subject to change, and any opinions or forecasts contained herein are subject to change without notice.
Disclosures
Past performance is not indicative of future results. Sage Mountain Advisors, LLC (“SMA”) is an independent SEC registered investment advisor. Any reference to or use of the terms “registered investment adviser” or “registered,” does not imply that SMA or any person associated with SMA has achieved a certain level of skill or training. This material is provided for informational and educational purposes only.
Any subsequent, direct communication by SMA with a prospective client shall be conducted by a representative that is either registered or qualifies for an exemption or exclusion from registration in the state where the prospective client resides. For more information pertaining to the registration status of SMA, please contact SMA or refer to the Investment Adviser Public Disclosure website (www.adviserinfo.sec.gov). The information contained herein should not be construed as personalized investment, tax, or legal advice. Certain information contained in this presentation has been derived from third party sources. While we believe these sources to be reliable, we make no representations as to the accuracy, timeliness, and completeness of any such information prepared by any unaffiliated third party incorporated herein, and take no responsibility therefore. As such, there is no guarantee that the views and opinions expressed in this presentation will come to pass.
All investments carry a certain degree of risk of loss, and there is no assurance that an investment will provide positive performance over any period of time. The statements contained herein reflect opinions, estimates and projections of SMA as of the date hereof, and are subject to change without notice. SMA reserves the right to modify its current investment strategies and techniques based on changing market dynamics or individual portfolio needs. The opinions expressed herein are those of SMA and are subject to change without notice. Information presented should not be considered as a solicitation or recommendation to buy or sell any security, financial product, or instrument discussed herein. Additionally, this material contains certain forward-looking statements which point to future possibilities. Due to known and unknown risks, other uncertainties and factors, actual results may differ materially from the results portrayed or implied in such forward-looking statements. Furthermore, the illustrative results presented in this presentation in no way reflect the performance of any SMA product or any account of any SMA client, which may vary materially from the results portrayed for various reasons, including but not limited to, investment objectives, financial situations and financial needs of SMA clients; differences in products and investment strategies offered by SMA; and other factors relevant to the management of SMA client accounts.
This presentation and its contents are provided “as is” without warranty of any kind, express or implied, including, but not limited to, implied warranties of merchantability, fitness for a particular purpose, title, non-infringement, security, or accuracy. SMA reserves the right to modify its current investment strategies and techniques based on changing market dynamics or client needs. It should not be assumed that any of the security transactions, holdings or sectors discussed were or will prove to be profitable, or that the investment recommendations or decisions we make in the future will be profitable or will equal the investment performance of the securities discussed herein.
Actual investment advisory fees incurred by clients may vary. A complete description of SMA’s fee schedule can be found in Part 2 of its FORM-ADV which is available at www.sagemountainadvisors.com or by calling (404) 795-8361. Clients are advised that no portion of the services provided by SMA should be interpreted as legal, tax or accounting advice. For legal and tax-related matters, we recommend that you seek the advice of a qualified attorney, accountant or tax professional. SMA-25-0388