SAGE MOUNTAIN 945 East Paces Ferry Rd NE, Suite 2660, Atlanta, GA 30326
Sage Mountain Research
Market Update – Q4 2022
2022 saw a historic increase in interest rates, coupled with global recession fears and a search for safety
Stubbornly high inflation caused the Fed to raise rates at a rapid pace in 2022. The Fed Funds rate ended the year at 4.5%, sharply higher than the 0.9% rate the Fed itself projected coming into the year. However, recent inflation reports as well as forward looking indicators, like rents on new apartment leases, show that inflation may have finally peaked, and it will likely continue to decelerate in 2023. The Fed began to slow the pace of rate hikes at their December meeting. We expect they will slow the pace further and end this cycle with rate increases of 0.25% in February and March.
With the unusual combination of higher interest rates coupled with lower equity prices, nearly all asset classes struggled in 2022. The Bloomberg US Aggregate Bond Index had by far its worst year ever, finishing down -13% vs. the previous worst full year return of -2.9% in 1994. The traditional 60/40 portfolio had its third worst year on record with a return of -16.1%. Commodities provided one of the only bright spots within public markets but have still delivered losses over the past decade.
Our recommendations to shorten duration in fixed income and diversify into alternative asset classes added value this year. Overweighting the US vs. international stocks slightly detracted from returns after years of positive impact. We continue to maintain these views, while watching for signals to lean into duration, adjust relative positioning within equities, and identify unique opportunities within private markets.
Equity valuations have improved over the past year and higher interest rates provide an attractive entry point for fixed income investors. Still, significant risks remain. The consensus 12-month recession probability is 65%. The Russian invasion of Ukraine has disrupted energy supplies in Europe. The narrow GOP majority in the US House could create volatility as we approach the debt limit later this year. In periods of stress, we believe it is imperative to maintain a long-term view. History shows that trying to predict the bottom is impossible, but markets have historically rebounded over the following few years.

Fixed income ended the year down due to a sharp increase in interest rates.
Equities struggled as higher rates and supply chain woes weighed on valuations. Commodity prices soared in the first half of 2022, led by oil, but receded over the last six months.
Alternative assets like private equity and real estate have generated higher returns than public markets, although with potentially stale data.
The US Dollar posted strong gains vs. other currencies but tumbled in Q4.
A 60% equity / 40% bond portfolio salvaged some performance in the 4th quarter to end the year down -16.1%. Despite the difficult year, it has still returned 9.2% per year over the past 10 years.
Illustrative current positioning and asset class views
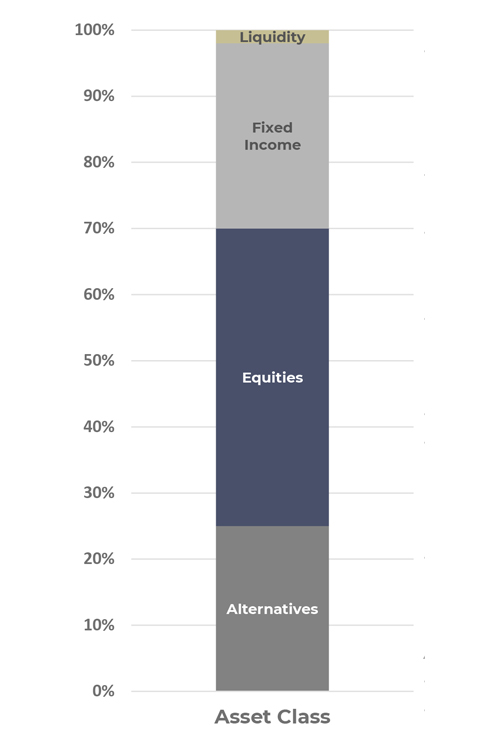 Liquidity
- One benefit of the rise in interest rates is higher yields on cash. With yields on money market funds near 4% or higher, we strategically utilize those high yielding cash instruments to earn income while ensuring we meet clients’ liquidity needs.
Fixed Income
- 2022 saw the fastest increase in rates from the Federal Reserve in history, leading to large broad-based declines in fixed income.
- We remain overweight shorter duration on the curve, which has been beneficial as longer-term bonds sold off on fears of higher rates. In Q4 this began to reverse. Given the higher starting yields and elevated recession risk, we will consider selectively adding duration as a hedge against equity downside.
- Additionally, our tactical decision to use SPACs in the space was additive as bonds sold off throughout 2022. We shifted exposure to municipal bonds mid-year to take advantage of higher rates.
Equities
- Equity markets suffered their largest losses since the 2008 crisis.
- We continue to overweight US equity markets vs international (4:1 allocation) which helped through most of
the year but did detract as a late 4Q rally in international equities boosted returns. We recommend maintaining target weights to international equities as potential US dollar weakness driven by decelerating inflation and the end of the Fed hiking cycle could be a tailwind for US investors in international equities. - Additionally, we continue to favor Quality as a factor tilt within equities. Compared to the overall market, a quality filter is slightly return enhancing and volatility reducing most years. While quality provided a boost to returns over the last few years, 2022 proved more challenging depending on the implementation vehicle.
Alternatives
- Alternatives remain a predominant asset class within our portfolios to diversify risk and drive capital growth.
- Private real estate was one of the best performing asset classes in 2022. Higher debt costs could dampen near
term returns, but long-term fundamentals for sectors like housing, industrial, and medical office remain
strong. - Given the recent downturn, we believe diversified venture capital funds with fresh capital will be
able to invest at attractive valuations. Secondaries funds across assets classes are also well-positioned
to take advantage of stressed markets.
Implied yields of 3-Month Eurodollar futures—a proxy for the expected Fed Funds Rate—increased significantly

The chart below shows current expected rates compared to January 3 and our prior update on September 30.
Expectations have stabilized after a rapid and unexpected increase over the first three quarters of 2022.
Markets are now pricing a peak rate of 5.1% in March 2023, implying hikes of 0.25% in February and March.
That is a modest increase vs. the expected peak of 4.7% as of September 30, while expectations for longer term rates have moved slightly lower.
Has inflation finally peaked?
Consumer Price Index Less Food and Energy, 2019- 2022

The inflation trend over most of 2022 explains the Fed’s aggressive approach, but the October and November CPI reports show encouraging signs of decelerating inflation.
There are key differences in 2023 relative to the rising and sustained inflation experience in 2021 and 2022:
- Energy prices have rolled over and will feed into broader prices.
- The Fed has been hiking rates aggressively which has already shown tentative results.
- The cooling housing market and sharp decrease in rent increases on new leases will start to feed through to Core CPI.
- The 5-year breakeven inflation rate has fallen from 3.5% in March 2022 to 2.2% today.
Inflation signals declines ahead, but moderation will take time

Inflation continues to be the leading concern for investors and the Federal Reserve throughout 2022. After peaking at 9.1% vs. the year before in June, the pace of inflation gains has fallen for five straight motnhs. Falling energy prices drove most of the decline while stickier pieces, such as shelter inflation, have continued to rise.
Looking ahead, broad inflation pressures are clearly trending lower as layoffs increase and both consumers and corporations cut back on expenditures. Shelter costs are coming off their unsustainable pace as rents are flat to down on new leases.
Inflation expectations for broad market participants are slightly higher than historical averages, with the average annual CPI inflation for the next five years between 2.0% – 3.0%, above the Federal Reserve long-term target of 2.0%. While the path to normalcy will be jarring at times, easing supply chain pressures and weak demand growth as stimulus runs out should allow inflation to subside over the next few years.
Forecasters’ 2023 recession probabilities are significantly higher than normal
The consensus 12-month recession probability is 65%. While banks like Goldman Sachs place the odds lower at 35%, that is still 2-3x the historical average recession odds.
Goldman Sachs (Jan Hatzius, November 2022): Goldman expects the US to narrowly avoid recession: “We expect global growth of just 1.8% in 2023, as US resilience contrasts with a European recession and a bumpy reopening in China.”
JP Morgan (Karen Ward, November 2022): Our core scenario sees developed economies falling into a mild recession in 2023. However, both stocks and bonds have pre-empted the macro troubles set to unfold in 2023 and look increasingly attractive, and we are more excited about bonds than we have been in over a decade.
Blackrock Global Outlook (December 2022): Central bankers won’t ride to the rescue when growth slows in this new regime, contrary to what investors have come to expect. They are deliberately causing recessions by overtightening policy to try to rein in inflation. That makes recession foretold. We see central banks eventually backing off from rate hikes as the economic damage becomes reality. We expect inflation to cool but stay persistently higher than central bank targets of 2%.”
HSBC (Willem Sels, December 2022): HSBC doesn’t explicitly call for a recession, but one can interpret their positioning as expecting economic weakness. They recommend:
- Underweight equities – building recession resistant portfolios (overweight quality),
- Overweight bonds but with a focus on short-to- medium maturities and quality borrowers, and
- We moved USD to neutral (this suggests a near term peak in rates).
Barclays (Ajay Rajadhyaksha, November 2022): Advanced economies are heading into a recession, led by the euro area and the UK. But the US will also likely contract across 2023, as the lagged effects of a super-fast hiking cycle finally hit the economy.
Citigroup (David Bailin, December 2022): In the US, we expect a mild recession, with regions such as the Eurozone being more heavily impacted. As inflation subsides, we see the US Federal Reserve pivoting from interest rate hikes to cuts and markets shifting focus to 2024 recovery. . . We remind investors that over the past 100 years, no bear market associated with a recession has bottomed before the recession has even begun.
Equities have gotten cheaper. Forecast returns for 2023 are modest, but with a wide range of possible outcomes.
The P/E ratios for the S&P 500 based on trailing and forward 12 months earnings are currently 19.9x and 16.8x. Those are down from 22.3x and 20.6x at the end of 2021, driven by the unexpectedly large increase in interest rates in 2022.
The median estimate of 22 forecasters compiled by Bloomberg is for the S&P 500 to end 2023 at 4,075 for a total return of 8%. Estimates range from a low of 3,400 to a high of 4,750. Consensus earnings estimates for 2023 and 2024 are $230 and $253.
We constructed a range of estimates for the year-end 2023 level of the S&P 500 based on historical P/E ratios combined with typical changes to earnings estimates. The P/E ratios shown reflect the 25th percentile to 75th percentile of the historical range, and the earnings estimates reflect the 25th percentile to 75th percentile of the annual miss vs. consensus (for 2023) and the annual earnings estimate revisions (for 2024).
The highlighted values, which are based on the median P/E ratios and change to consensus earnings, imply a 2023 return of 0.5% to 5% for the S&P 500. There is upside to a double-digit return if valuations remain at their current level and estimates do not fall further.


Given time, the market always rebounds
5-Year Returns From Bear Market Troughs

Evolution vs. good financial decision-making
Our brains predispose us to behavioral biases that can result in serious mistakes.
| Bias | Example | Mitigation |
|---|---|---|
| Anchoring – Fixating on the first value you saw. | “I can’t buy (sell) now – stocks are so much higher (lower)!” | Acknowledge the past anchor; keep your mind on the future goal. |
| Confirmation – Filtering out evidence contrary to your opinion. | Getting information from a source that always leans bearish or bullish. | Admit different situations call for different expertise; avoid groupthink. |
| Herding – Feeling more comfortable doing what others are doing. | Often subconscious – “The smartest investors I know are bearish.” | Remember financial situations are not social situations – running with the crowd is often wrong, especially at sentiment extremes. |
| Recency – The last information you absorbed looms larger in mind. | “The market fell a lot last year on bad news, that should continue since things are still bad.” | Financial patterns do not continue forever; rather they often have the seeds of their own demise as high prices bring in new competition. |
| Loss aversion – Losses “feel” much worse than equivalent gains. | Selling too fast OR holding too long to avoid dealing with the pain of a loss. | Try to recall that fundamental changes, not price changes, should impact your decisions. The value of the stock/bond/ building simply is what it is regardless of how we feel. |
Source: CFA Institute, Wikipedia, Fidelity
Disclosures
Past performance is not indicative of future results. Sage Mountain Advisors, LLC (“SMA”) is an independent SEC-registered investment advisor. Any reference to or use of the terms “registered investment adviser” or “registered,” does not imply that SMA or any person associated with SMA has achieved a certain level of skill or training. This material is provided for informational and educational purposes only.
Any subsequent, direct communication by SMA with a prospective client shall be conducted by a representative that is either registered or qualifies for an exemption or exclusion from registration in the state where the prospective client resides. For more information pertaining to the registration status of SMA, please contact SMA or refer to the Investment Adviser Public Disclosure website (www.adviserinfo.sec.gov). The information contained herein should not be construed as personalized investment, tax, or legal advice. Certain information contained in this presentation has been derived from third-party sources. While we believe these sources to be reliable, we make no representations as to the accuracy, timeliness, and completeness of any such information prepared by any unaffiliated third party incorporated herein, and take no responsibility therefore. As such, there is no guarantee that the views and opinions expressed in this presentation will come to pass.
All investments carry a certain degree of risk of loss, and there is no assurance that an investment will provide positive performance over any period of time. The statements contained herein reflect opinions, estimates, and projections of SMA as of the date hereof, and are subject to change without notice. SMA reserves the right to modify its
current investment strategies and techniques based on changing market dynamics or individual portfolio needs. The opinions expressed herein are those of SMA and are subject to change without notice. Information presented should not be considered as a solicitation or recommendation to buy or sell any security, financial product, or instrument discussed herein. Additionally, this material contains certain forward-looking statements which point to future possibilities. Due to known and unknown risks, other uncertainties, and factors, actual results may differ materially from the results portrayed or implied in such forward-looking statements. Furthermore, the illustrative results presented in this presentation in no way reflect the performance of any SMA product or any account of any SMA client, which may vary materially from the results portrayed for various reasons, including but not limited to, investment objectives, financial situations and financial needs of SMA clients; differences in products and investment strategies offered by SMA; and other factors relevant to the management of SMA client accounts.
This presentation and its contents are provided “as is” without warranty of any kind, express or implied, including, but not limited to, implied warranties of merchantability, fitness for a particular purpose, title, non-infringement, security, or accuracy. SMA reserves the right to modify its current investment strategies and techniques based on changing market dynamics or client needs. It should not be assumed that any of the security transactions, holdings, or sectors discussed were or will prove to be profitable, or that the investment recommendations or decisions we make in the future will be profitable or will equal the investment performance of the securities discussed herein.
Actual investment advisory fees incurred by clients may vary. A complete description of SMA’s fee schedule can be found in Part 2 of its FORM-ADV which is available at www.sagemountainadvisors.com or by calling (404) 795-4861. Clients are advised that no portion of the services provided by SMA should be interpreted as legal, tax or accounting advice. For legal and tax-related matters, we recommend that you seek the advice of a qualified attorney, accountant, or tax professional. SMA-22-000470