
SAGE MOUNTAIN 945 East Paces Ferry Rd NE, Suite 2660, Atlanta, GA 30326
Sage Mountain Research
Market Update – Q1 2024
Q3 recap and Q4 outlook…
Markets navigated an unusually volatile macro backdrop in Q3. Oil prices experienced big swings, long-term Treasury yields rose to multi-decade highs, Fed expectations shifted from rate cuts to rate hikes, and the AI trade became more volatile. Despite the unsettled backdrop, the broad equity market avoided a sustained risk-off move, with credit spreads and equity volatility remaining relatively contained. The more noteworthy changes occurred beneath the surface. Factor and sector leadership became less stable, and the market rotated between themes for much of the quarter rather than moving in one clear direction.
Leadership changes were especially pronounced. Small caps underperformed large caps after leading for several quarters, while Technology and Industrials moved from Q2 leaders to Q3 laggards; Energy moved from the bottom of the sector rankings to the top. High Beta (i.e., riskier stocks) also experienced sharp monthly reversals as investors repriced growth, inflation, interest rates, and AI sentiment. At the same time, the equal- weight S&P 500 held up better than the Russell 2000, suggesting the market didn’t simply return to narrow mega-cap leadership. Instead, the clearer pattern was continual rotation, with leadership changing quickly across styles, sectors, and market- cap segments.
Interest rates and the AI investment cycle have also become increasingly connected. Long-term Treasury yields have risen significantly, tightening financial conditions even as the premium investors demand to hold riskier bonds remains relatively calm. This move reflects more than shifting Fed expectations, as inflation, oil prices, Treasury supply, and private-sector demand for capital push yields higher. AI remains one of the economy’s strongest growth engines, but the buildout is becoming more capital intensive. As spending on data centers and equipment accelerates, hyperscalers are increasingly relying on debt issuance. The question is shifting from whether AI spending can continue to how it will be financed, what returns the capital will generate, and whether increased demand for capital will raise interest rates and tighten financial conditions.
The market has taken events in stride so far, but the pressure may be rising. Oil prices are rising again, and Treasury yields are near multi-decade highs. Stress is also becoming more visible at the bottom of the credit market, where CCC (very low-quality bonds) spreads have widened even as broad high-yield spreads remain relatively tight. Individually, these signals don’t necessarily point to a broader downturn, but they are increasingly occurring at the same time. That puts even more weight on high-income consumers and AI datacenter capex to carry the economic load.
The market enters Q4 with very strong earnings growth and continued support from AI investment, but less room to absorb another macro shock without consequences. The key question is whether the pressures remain contained or begin to compound. Higher oil prices can keep inflation elevated, putting additional pressure on consumers, Treasury yields, and Fed policy. Higher yields in turn tighten financial conditions, raise borrowing costs, and strain the smallest and most leveraged companies.
So far, stress has remained concentrated among weaker borrowers rather than spreading through broader credit or equity markets. The environment is not broadly risk-off, but considerably more risk may be building beneath the surface than headline equity indexes suggest.
Alternative investments can really earn their keep during periods like this. Investors are understandably worried about stock market valuations and rising rates. It is a good time to make sure you have other sources of investment returns. In addition to private real estate, infrastructure, and other niche credit strategies, liquid alternatives such as trend following and arbitrage strategies can also help blunt drawdowns in other parts of the portfolio.
Market Snapshot – Index Returns
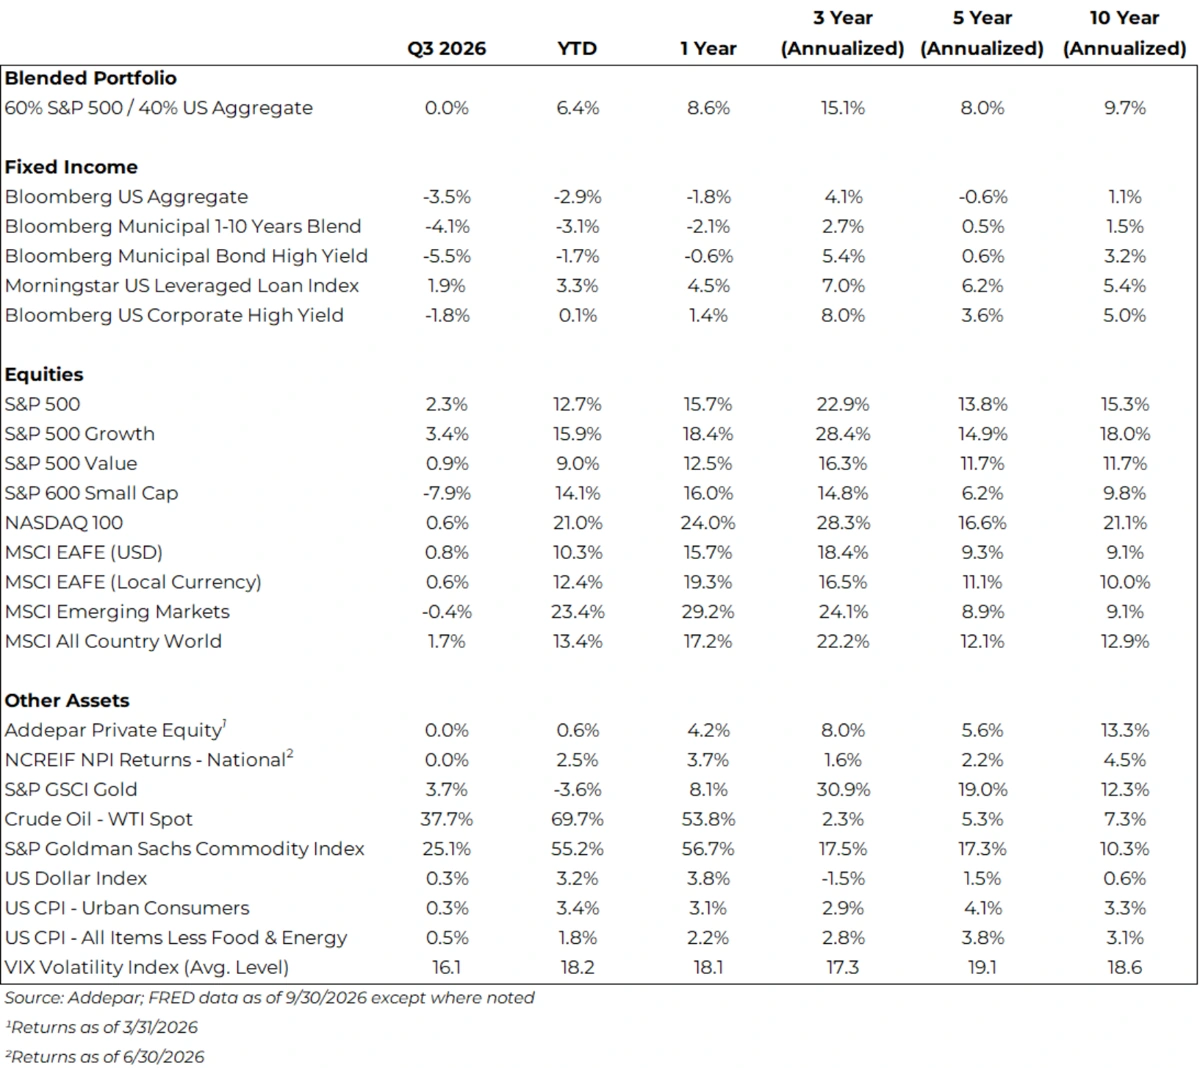
Tech and growth led stocks quarterly and YTD.
Emerging Market performance was greatly flattered by Korean and Taiwanese chipmakers (memory and chips for AI).
Gold was great last year but has stalled this year. Real yield hikes and lack of a sharp panic have kept gold’s performance limited.
Q3’s sharp interest rate increases have hit duration-exposed bonds hard, while credit risk has remained contained.
Equities: Q3 Review
Equities – Index Up, Carried by Tech Leaders
Takeaway: The S&P 500 returned +2.3% in Q3 (+12.7% YTD), but the gains were narrow as rising yields hit rate-sensitive areas. Large tech companies like Microsoft, Apple and semiconductor stocks propped up the index while weakness was widespread under the hood.
Sector leadership reversed from Q2. Energy (+17.2%), Technology (+7.2%) and Health Care (+6.5%) led, while Utilities (-12.4%), Industrials (-9.7%), Real Estate (-5.6%), and Consumer Discretionary (-5.1%) lagged.
Small caps gave back their lead. The Russell 2000 index of small-cap stocks fell about -6% over the quarter after outperforming large caps by more than 5% in both Q1 and Q2. The 10-year yield rose nearly 1% from its February low.
Breadth hit a multi-decade low. The index ended within about 2% of its high, but the median S&P 500 stock is 17% below its own high. According to Goldman Sachs, that is the weakest breadth since the dot-com bubble. Since the mid-August high, the equal-weight S&P has fallen about -6%, versus about -2% for the cap-weighted index.
International results were mixed. Emerging markets are +23.7% YTD, led by Korea (+98%) and Taiwan (+71%). China (-11.7%) and India (-14.7%) are down. EAFE is +10.8% YTD and fell about -1.6% over the last three months, with France at -2.2% YTD.
Source: MarketDesk
Equities Outlook
What supports stocks:
- Consensus expects Q3 S&P 500 EPS growth of +27% y/y, the highest going into any earnings season since 2021.
- Hyperscaler capex is expected to grow +116% y/y in Q3, and consensus is about $1.1T for 2027. Goldman expects hyperscaler cloud revenue growth to accelerate from +48% to +55%.
- Economic growth is still running very strong, and corporate margins are higher than ever. According to Fed Watch Advisor calculations, Q2 tariff rebates may have contributed as much as 20% of S&P 500 earnings growth.
- Seasonality has been favorable: per data from BlackRock, when the S&P 500 was up through September, Q4 was positive in 81% of years since 1979.
What we are watching:
- Housing: Housing, the traditional driver of consumer spending, is weakening, which could have negative implications for the “old economy.” Tech and Energy are expected to provide about 80% of Q3 earnings growth. EPS growth for the median stock is expected to slow from +14% to +9%.
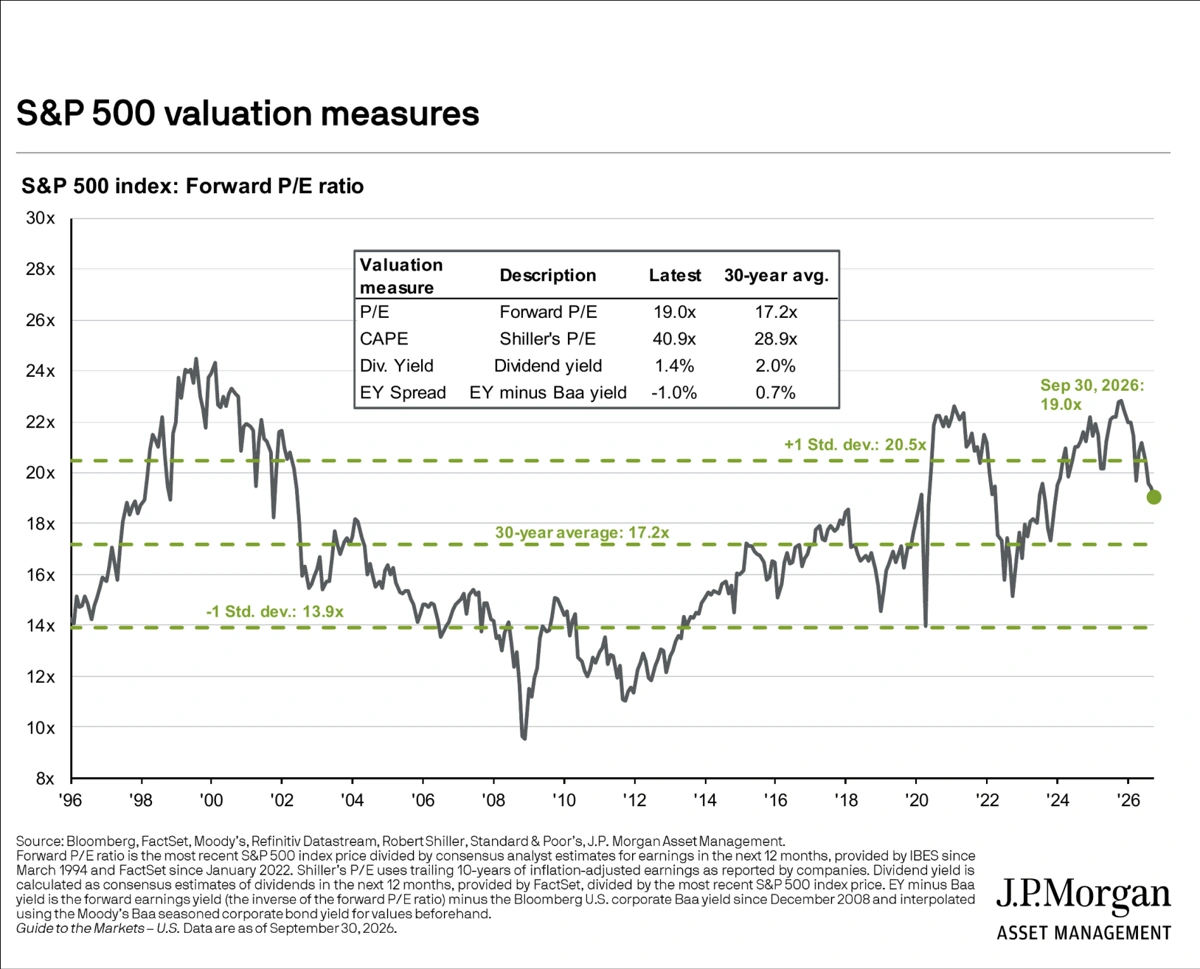
- Valuation versus bonds: The forward P/E is 19.0x–above the 17.2x average over the past 30 years, but below the level coming into the year. The forward earnings yield (about 5.2%) is now below the 10-year Treasury yield (5.29%). Historically, when that gap started near zero, equities trailed Treasuries over the following three years as documented by Morgan Stanley.
- Market Breadth: Some commentators are concerned about the dominance of the tech sector. However, strong earnings drive that strength (see slide 12), so we don’t think that alone warrants reducing equity exposure.
- Hormuz Resolution: While there is no immediate solution in sight; with the midterms in the rear-view mirror, it may be easier to find a settlement. In the meantime, equity markets have weathered the conflict so far.
Equities Outlook – Sources of Earnings Growth
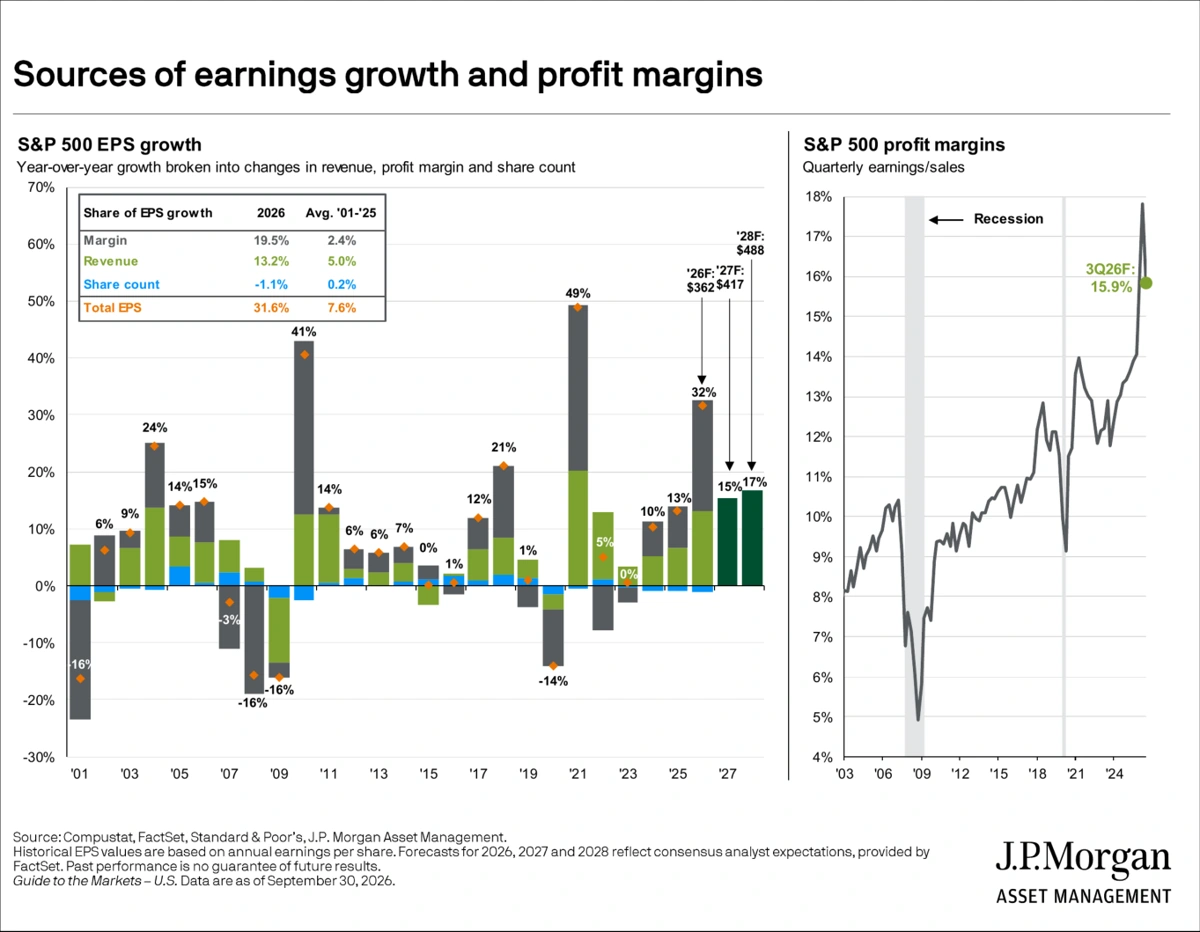
Strong profit margins again drove S&P earnings higher, with margins and revenues both contributing to the recent earnings acceleration.
Equities Outlook – Stellar Earnings
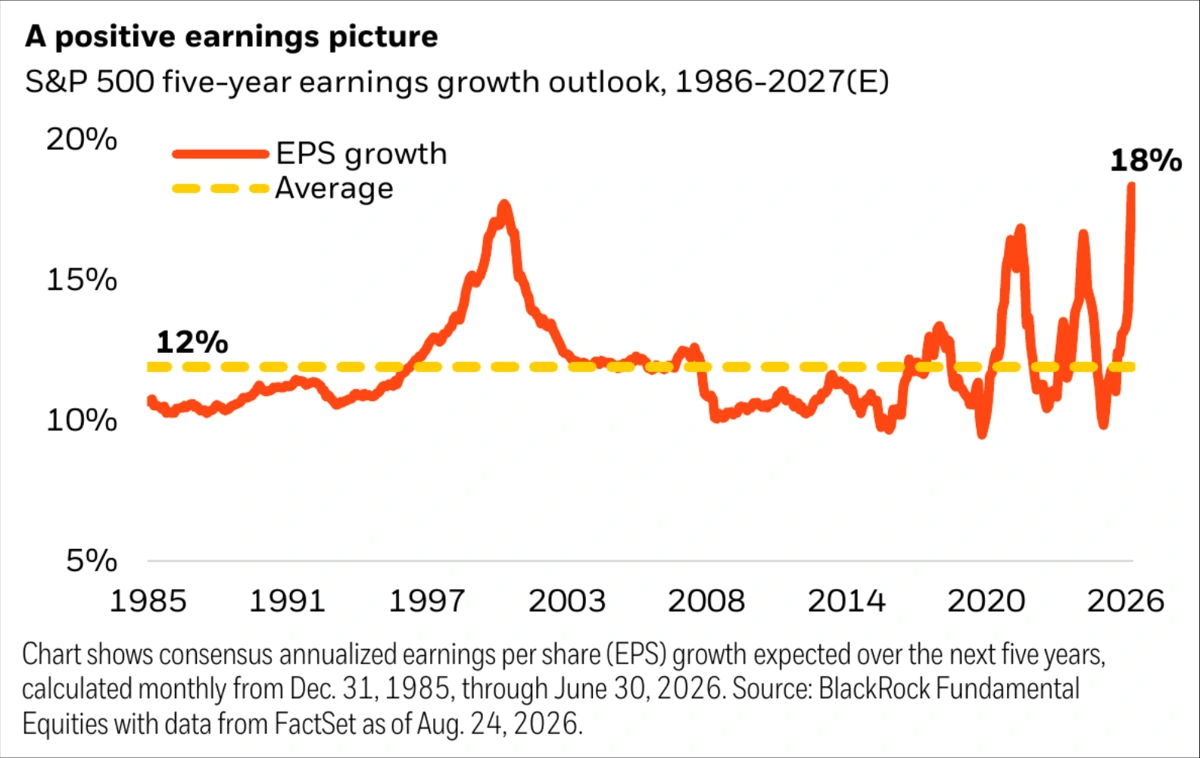
Q3 earnings season begins shortly – expectations are high but have been surpassed repeatedly. This chart shows how unusual this period is, although periods of strong earnings growth have become more common since 2020.
Q4 2026 Equities Outlook – Tech and Everything Else
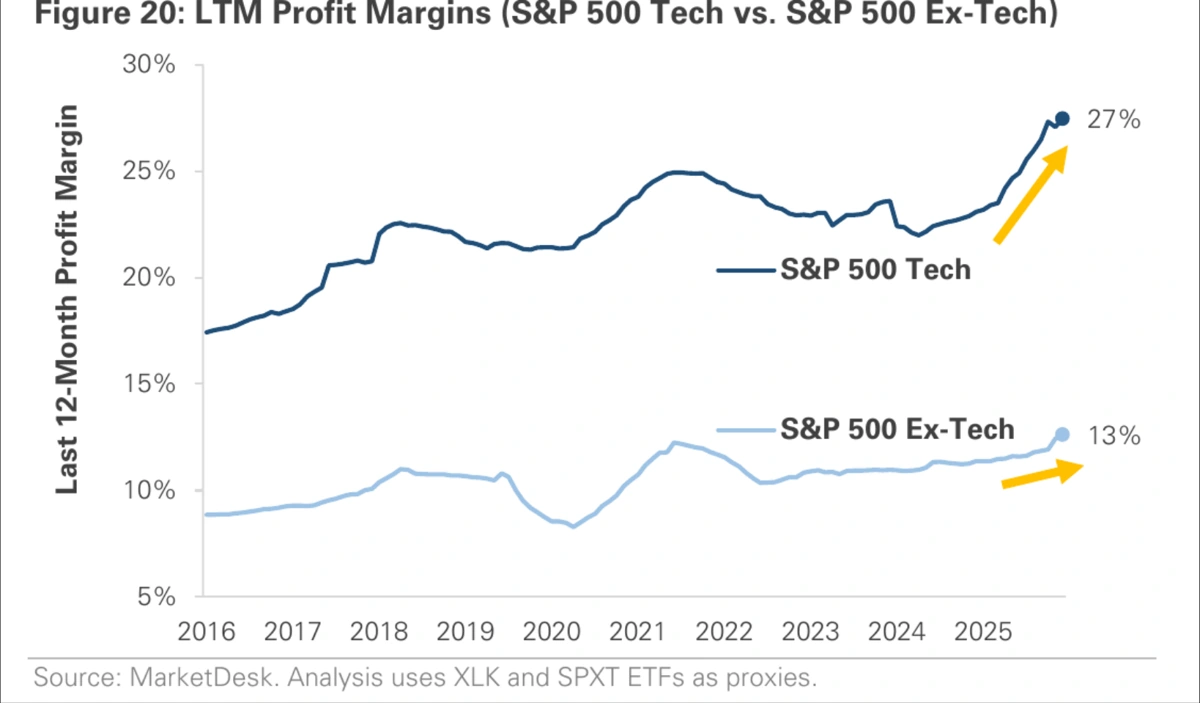
From the earnings perspective, we have seen slight margin expansion even outside of technology, but nothing like what is seen in the white-hot areas supplying AI capital expenditures and the cloud computing giants like Microsoft.
Q4 2026 Equities Outlook – Valuations Are High, But Below Recent Peaks, and Earnings Keep Accelerating
Q4 2026 Equities Outlook – Perspective on Concentration
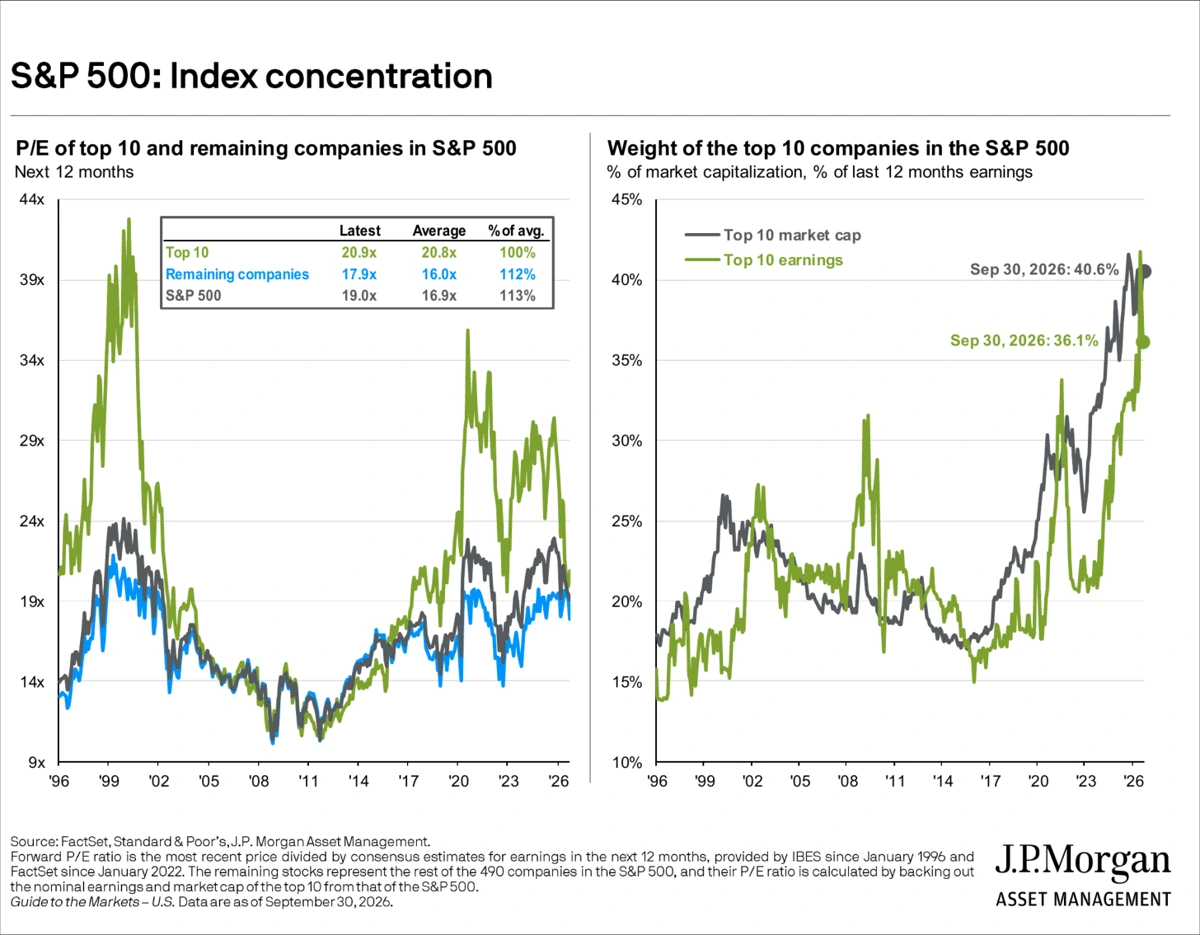
While the S&P 500 Index is highly concentrated today, the market value concentration in the top 10 companies is commensurate with their earnings, and their valuations are in line with the 30-year average.
Fixed Income: Q3 Review
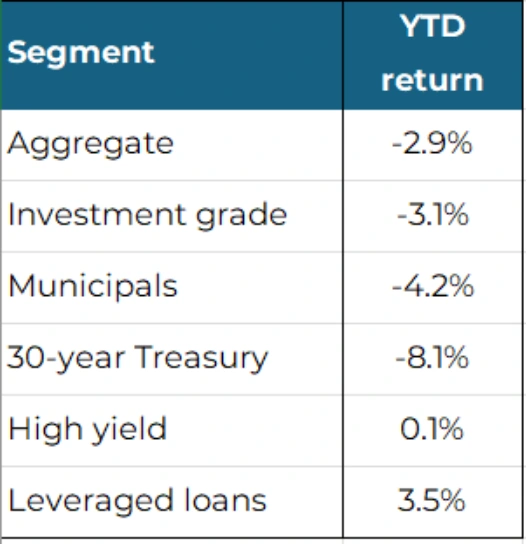
Long Yields Reach Their Highest Since 2002
Yields rose across the curve in Q3. This hurt bond returns, but left starting yields at multi-decade highs.
The Fed raised rates 25 bp in September to a target range of 3.75–4.00%, and the FOMC median projects one more hike in 2026. Core PCE inflation, the Fed’s preferred measure, is 3.3% y/y.
Long rates moved most. The 10-year Treasury yield ended the quarter at 5.29%, up from 4.18% at the end of 2025, while the 30-year finished at 5.64%, up from 4.84%. Both are at their highest levels since 2002.
Source: MarketDesk
Drivers went beyond Fed policy: Oil, higher Treasury supply, investors demanding more to hold long-maturity bonds, and hyperscaler net debt issuance of about $238B from 4Q25 through 2Q26 combined to push yields higher.
Fixed Income: Q4 Outlook
Higher Starting Yields, a Fed Still Hiking
Bond yields are at multi-decade highs, historically a good starting point. On the other hand, credit spreads remain tight, so credit analysis is crucial.
The FOMC median projects one more hike in 2026, bringing the Fed Funds rate to 4.00-4.25%. Per CME Group’s FedWatch data, markets are pricing a Fed Funds rate of 4.64% at the end of 2027. We think that may be overstating the extent of rate hikes over the next year.
Yields drive returns: the Bloomberg U.S. Aggregate yields 5.56%, with a real yield of 3.12% versus an average of 2.48% since 1976. According to JP Morgan, starting yield has explained 89% of the variation in subsequent 5-year returns (see slide 18 in the original PDF), so these higher yields indicate a high likelihood of higher bond returns moving forward.
Return asymmetry: projected 12-month Aggregate returns are +5.6% if rates are unchanged, +11.3% if they fall -1%, and -0.2% if they rise +1% (see slide 19 for additional detail in the original PDF).
Credit: spreads remain tight. Using MarketDesk data, the spread on investment-grade bonds is 0.84% vs. a median of 1.35%, and the high-yield spread is 3.12% vs. a median of 4.37%. However, stress is building at the bottom: the gap between low-quality CCC-rated and BB-rated bonds, which sit just below investment grade, is 9.77% vs. a median of 6.27%.
Positioning: We favor investment-grade, mortgage-backed securities, and floating-rate loans; be cautious on lower-quality high-yield bonds, as we believe spreads could widen further in the lowest-quality bonds.
Q4 2026 Fixed Income Outlook – Rate Outlook
Current Fed Funds Futures Curve
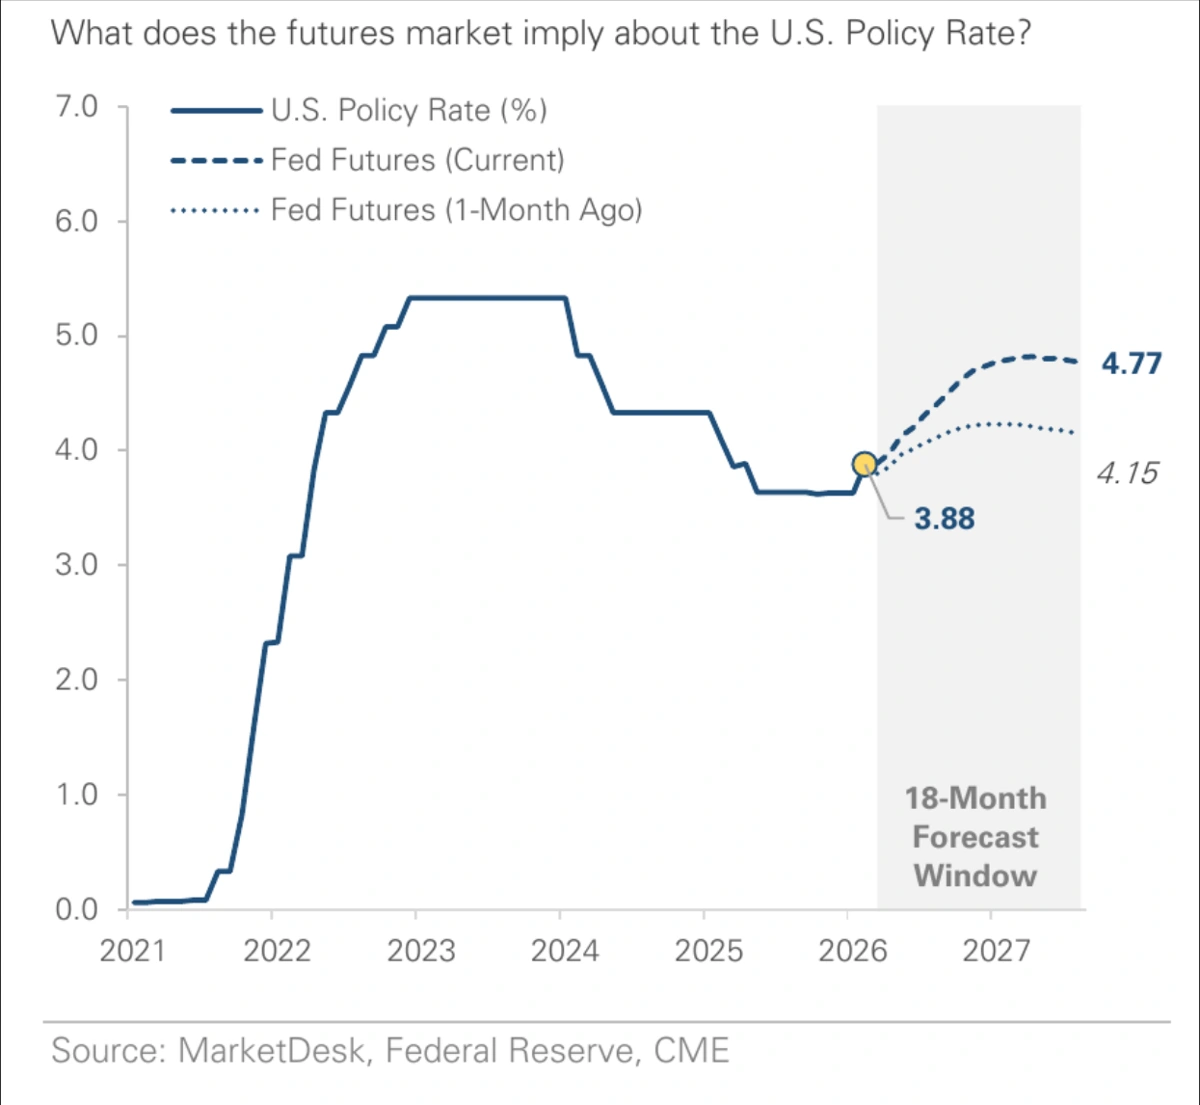
Expectations for Fed rate hikes have increased significantly over the past month.
We believe macro forecasting is very difficult, so investors should not make major changes based on views of the potential direction of interest rates.
Current drivers of higher rates include energy prices, AI capex, and ongoing demand for government borrowing. While we’re not making a call on magnitude or timing, investors should remember the first two drivers could reverse. Now isn’t the time to wholesale abandon investment-grade bonds, especially with the cushion provided by higher starting yields.
Q4 2026 Fixed Income Outlook – Real Yields Back to Normal
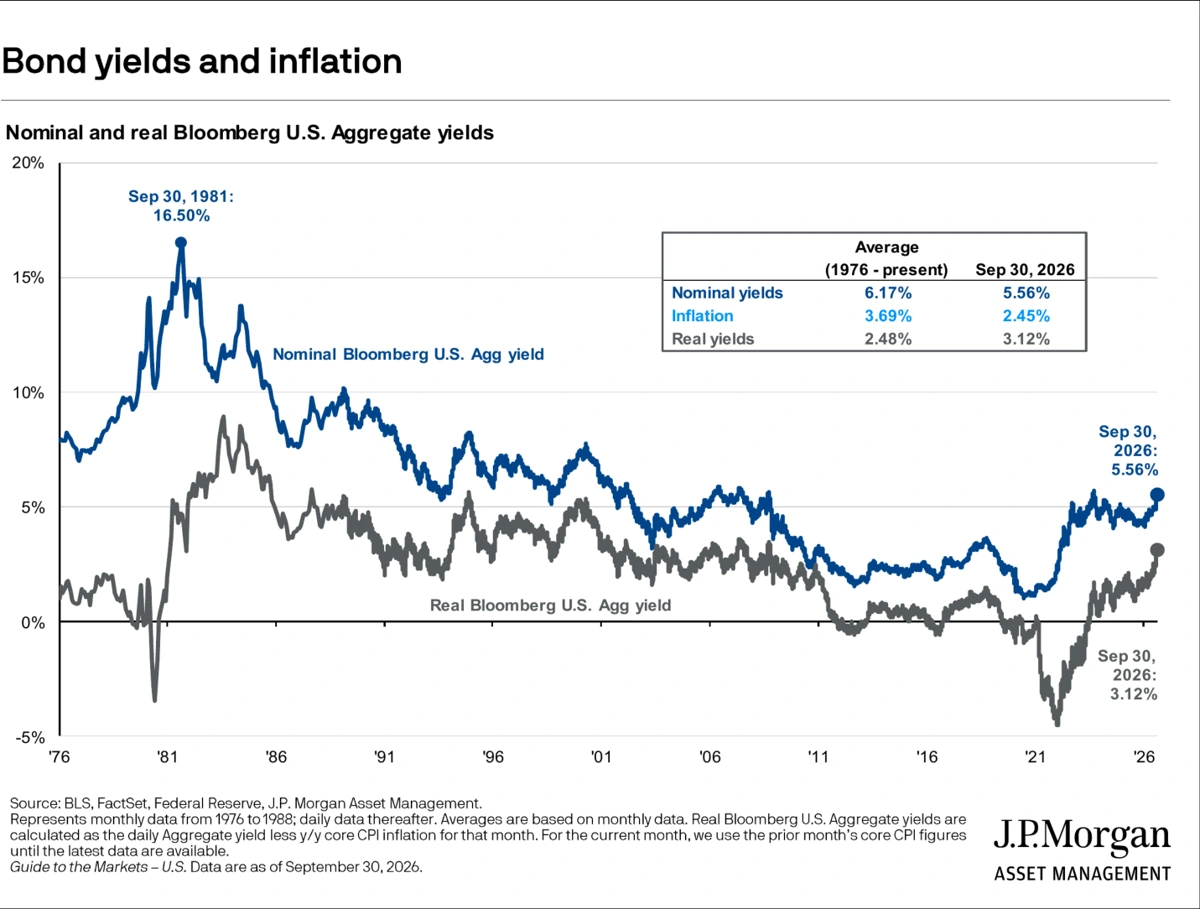
From a longer-term perspective, rates are normalizing – real yields (i.e. yields adjusted for inflation) are in positive territory and back to the level of the 1990s- 2000s. Many institutions still need to buy dollar assets guaranteed to return their principal.
Q4 2026 Fixed Income Outlook – Yields Drive Returns
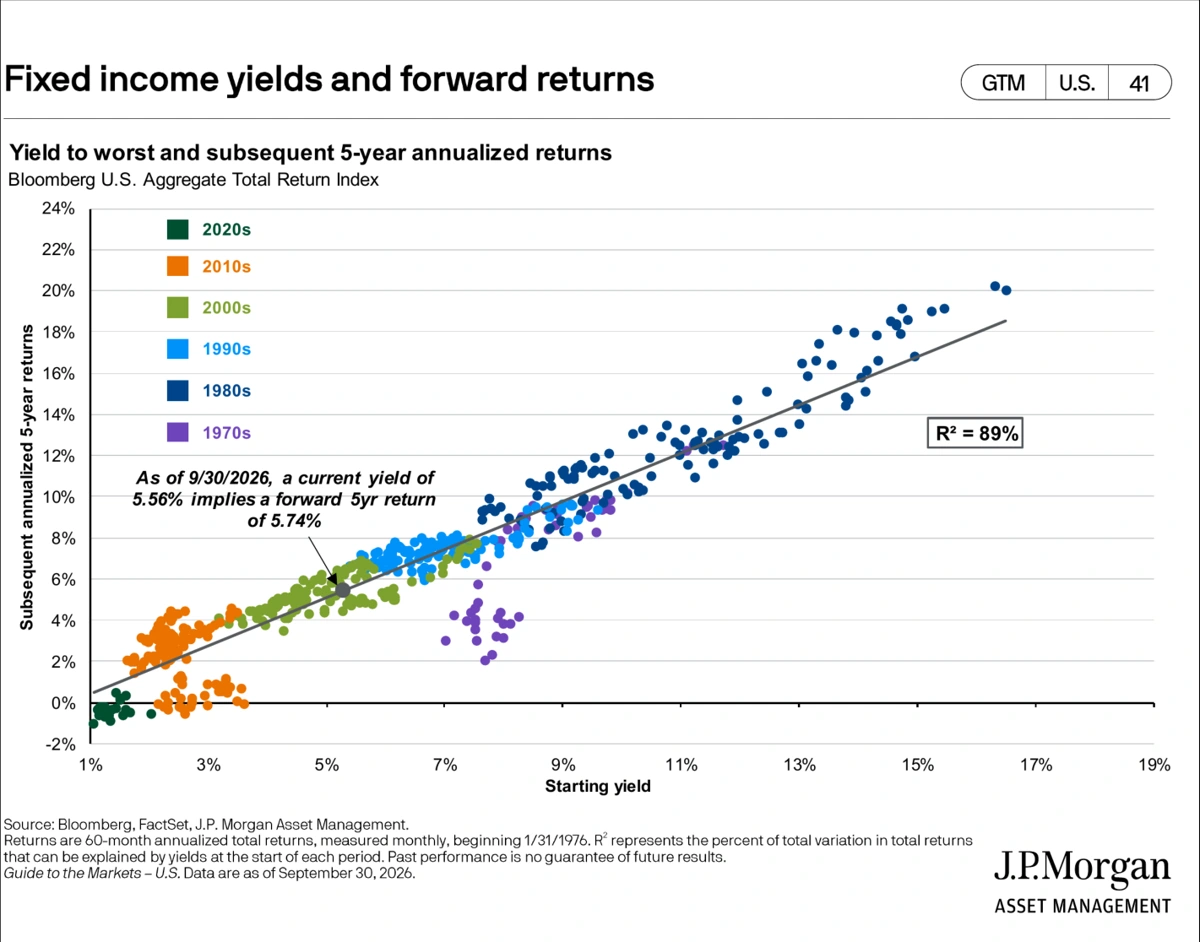
In every decade except the 1970s severe-inflation era, the starting yield was a strong guide to future returns. With positive real yields, we think this will likely be a good rule of thumb again, though we will undoubtedly experience some volatility as the economy and markets adjust to higher rates.
Q4 Fixed Income Outlook – Interest Rate Scenarios
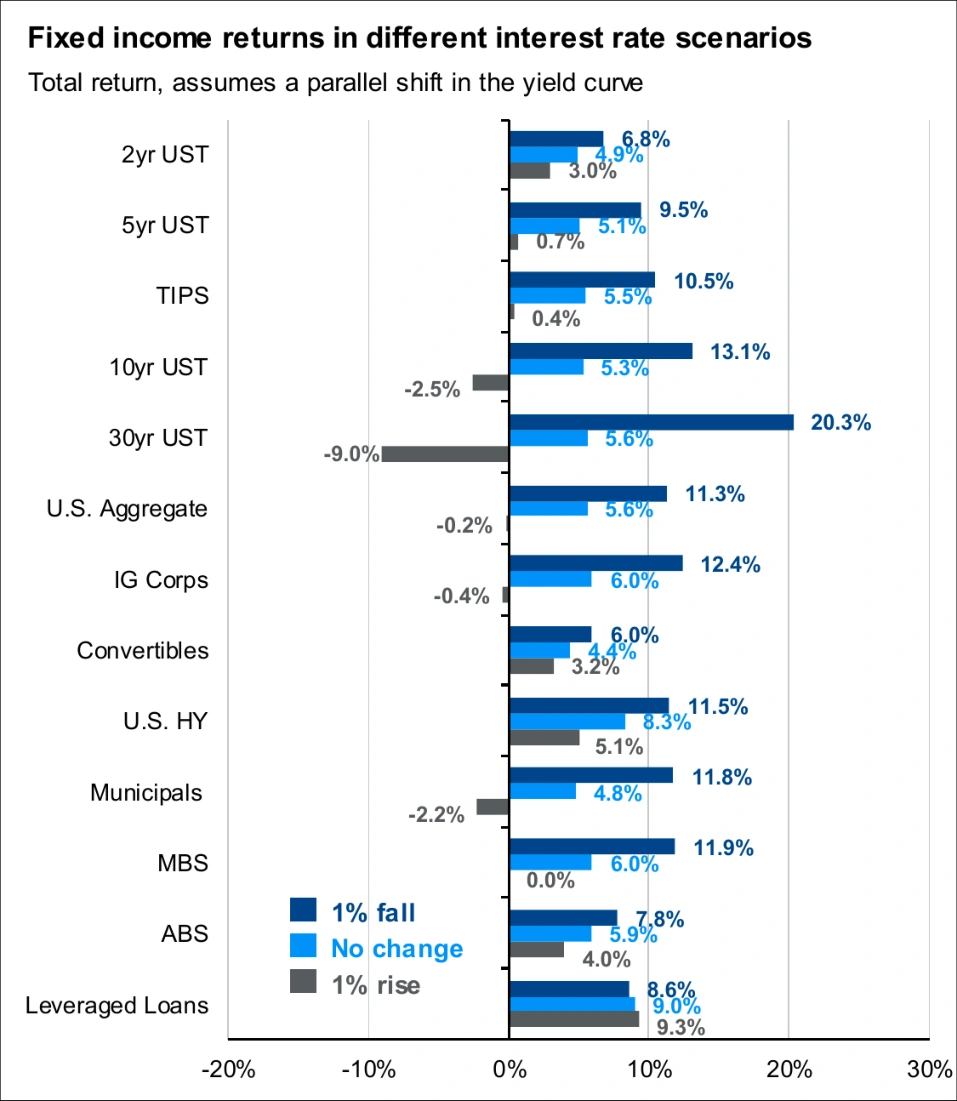
When yields start at a higher rate, they lose less on further hikes; conversely, when rates fall, returns are magnified.
Q4 Fixed Income Outlook – Hyperscaler Debt Issuance
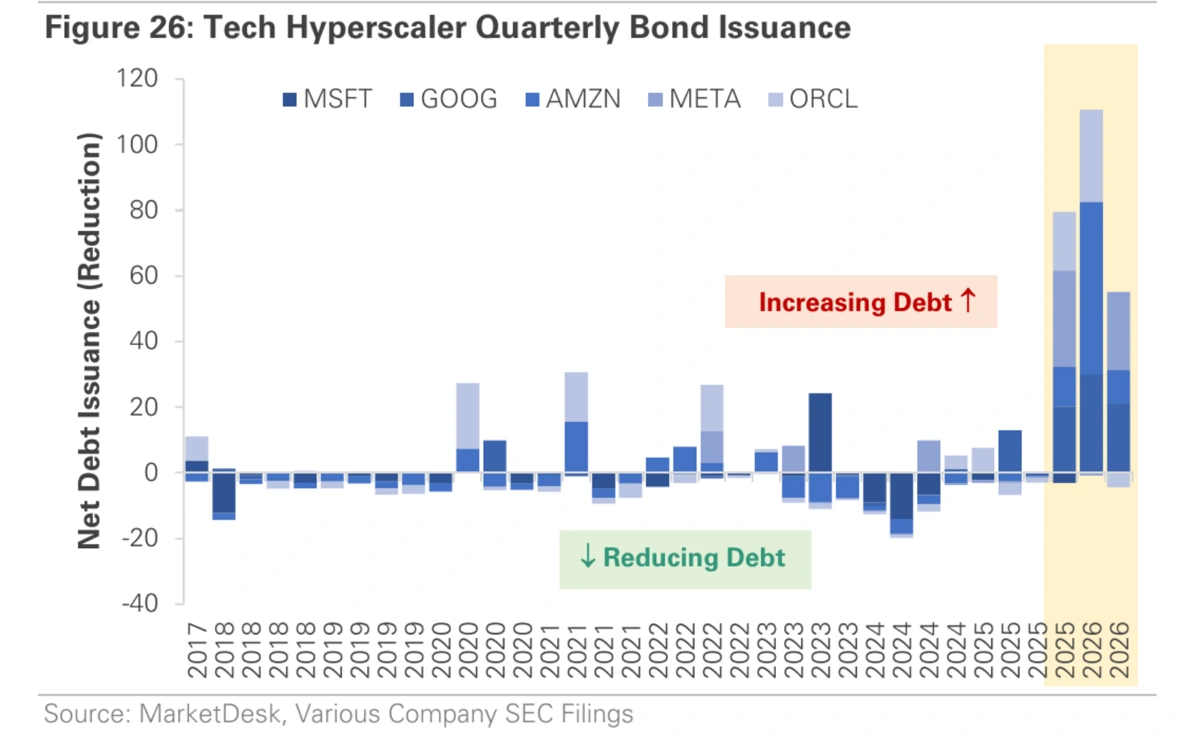
The scale of the hyperscaler debt issuance is nothing short of stunning. Executives of these companies must be confident that their returns on these investments will be good – or that they have no choice but to compete. But, while the numbers are large in absolute terms, per an analysis from JP Morgan, their adjusted leverage of 0.4x EBITDAR is lower than the index average of 1.9x, indicating significant additional capacity to issue debt.
Q4 Fixed Income Outlook – Bonds More Volatile
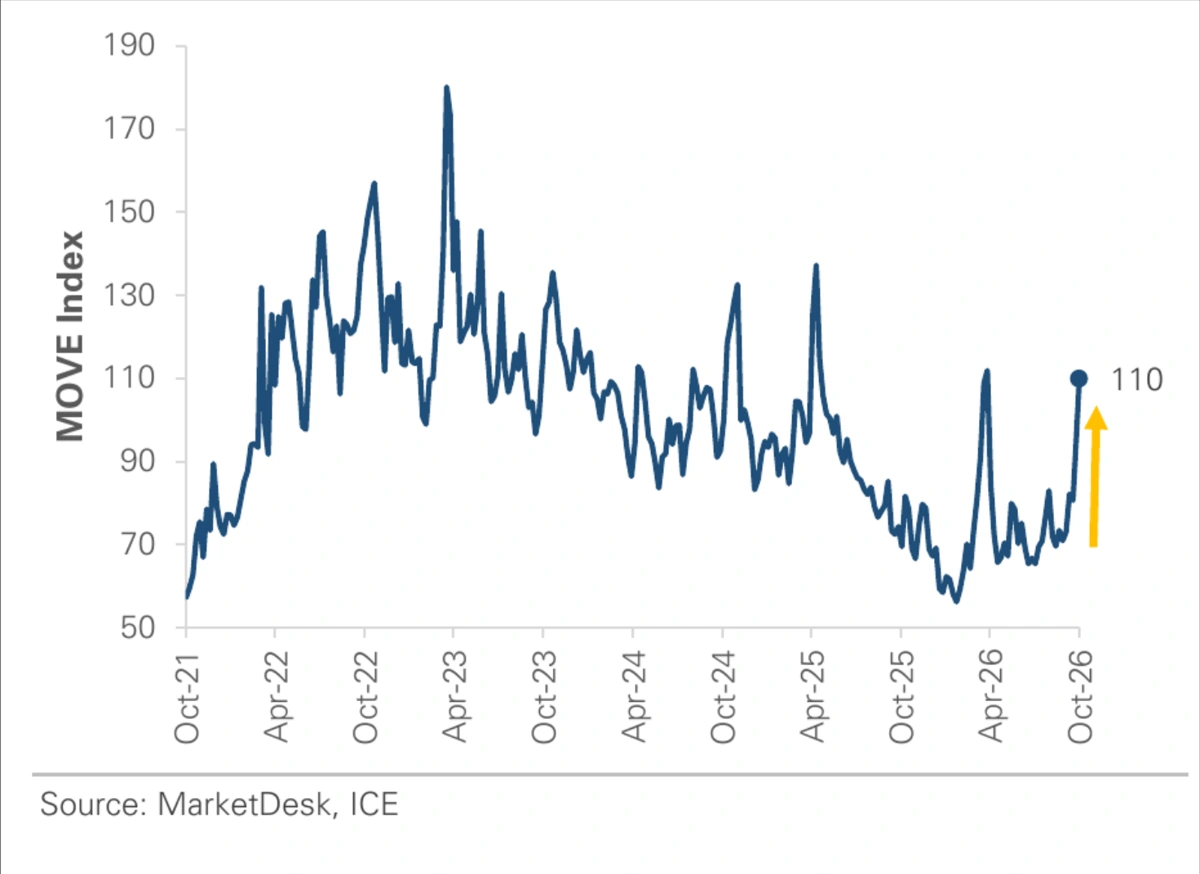
The MOVE Index reflects the level of volatility in Treasuries. As bond yields have risen and prices have fallen, bond trading has also become much more volatile. While bonds’ longer-term attractiveness has improved, holding them in the near term may be more difficult.
Q3 2026 Alternatives – Real Assets Led; Underwriting Matters More in Private Credit
Commodities: Energy-linked real assets and floating-rate credit outperformed. Hormuz crude flows are back above 75% of pre-war levels, but Middle East refined-product exports are still down about two-thirds. Meanwhile, Ukraine has been attacking Russian refineries with relentless drone strikes.
Real estate: According to MarketDesk, REITs fell -2.7% in Q3 as 30-year mortgage rates reached 7.23%. As of the most recent data from Q2 2026, private real estate returns were slightly positive, mostly from income.
Gold: -0.7% YTD in USD. Per Erste, central bank buying rose 62% y/y in Q2, but higher real yields offset that support.
Private credit: AI-disruption concerns are concentrated in software, and lenders are shifting to lower leverage and stronger covenants.
AI financing is moving private: J.P. Morgan projects $5.5T of AI buildout funding from 2026 to 2030, with $1.4T expected from alternative capital and governments.
Manager selection matters most in private markets. Return spreads between top- and bottom-quartile managers show no signs of tightening.
Alternatives Outlook – Private Equity Exits Deferred Again
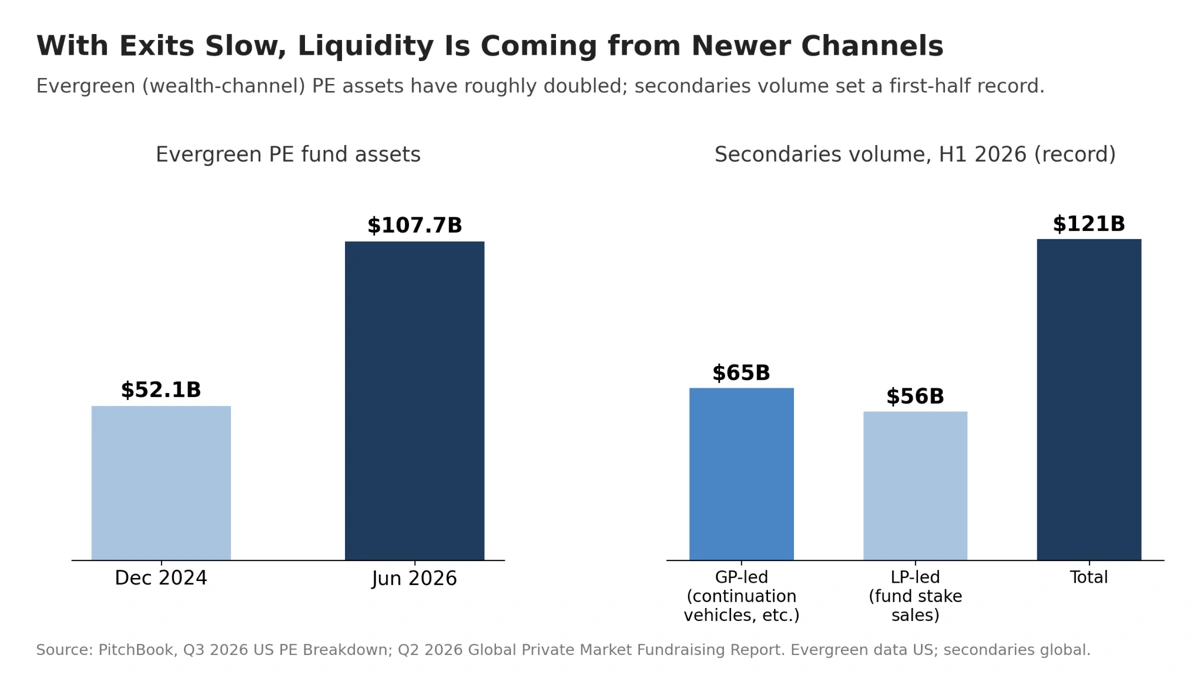
Exits from traditional vehicles have slowed, while continuation vehicles—a tool managers use to move assets from funds nearing the end of their life to newly created funds—and secondary market sales are picking up some of the slack. Private equity managers also continue to find success with the wealth channel and are offering more evergreen funds.
Alternatives Outlook – Infrastructure Investment
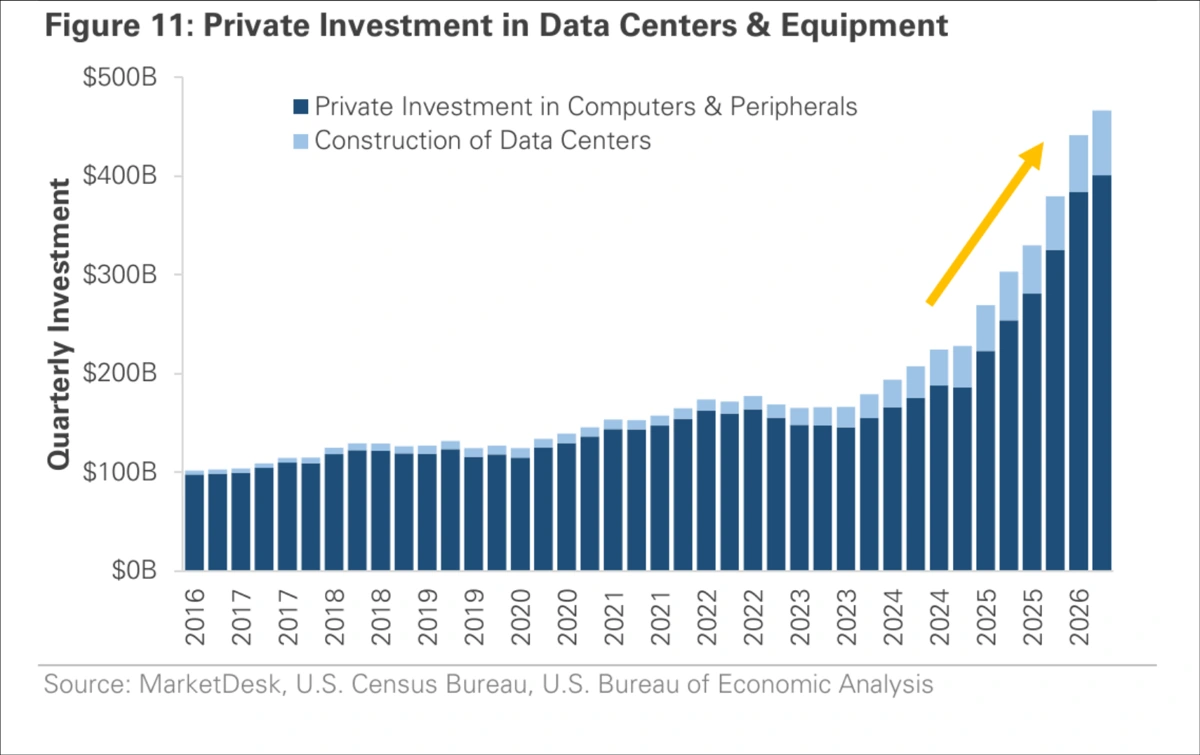
Infrastructure investing has become dominated by investment capital for data centers – “powered shell” buildings remain a major in-demand theme.
Alternatives Outlook – Gradual Real Estate Recovery
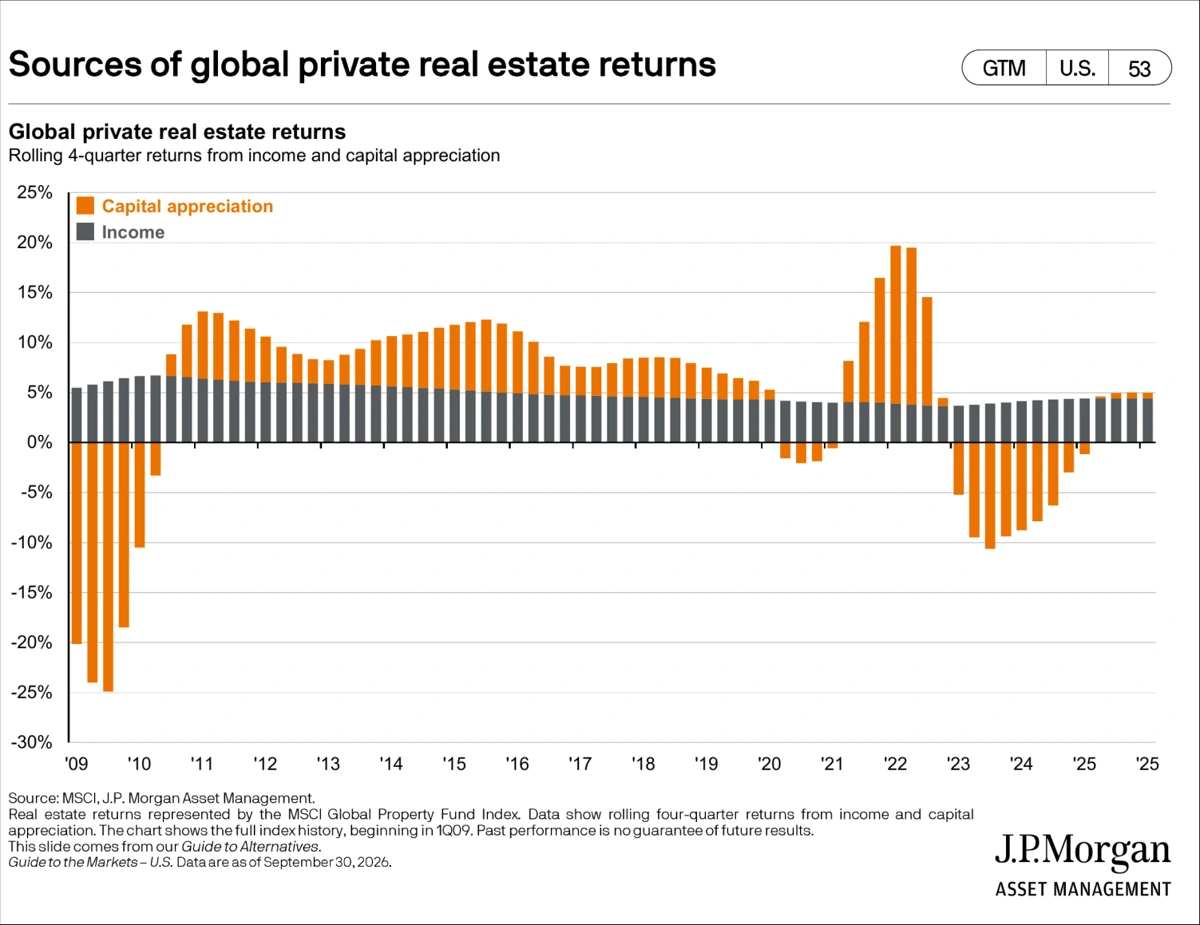
Private real estate commitments have been lower than in past years, helping supply catch up to demand. The chart above shows the reversal of the negative price trend, while income has remained steady.
Alternatives Outlook – Trend Following in Gear
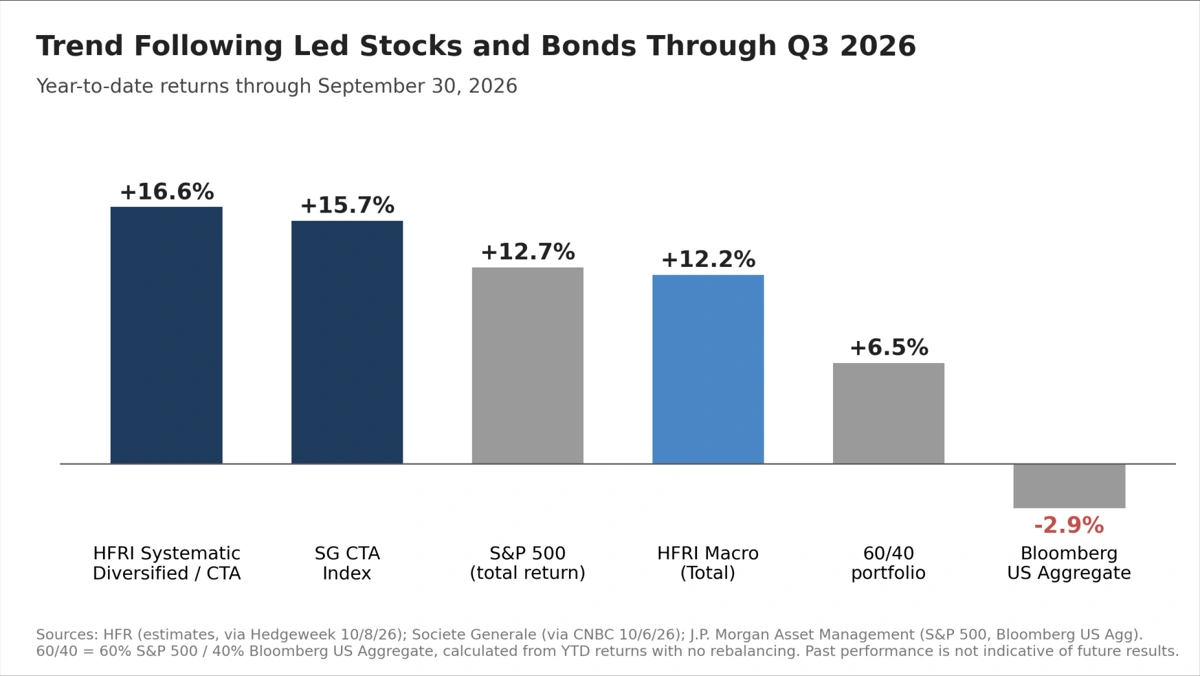
The chart above shows the continued success of trend-following/managed futures strategies, which have outperformed stocks, bonds, and every other major hedge fund category this year. Several well-established trends have held through most of the year, including declining bond prices, gains in technology stocks, and uptrends in oil and other commodities. We continue to believe that these strategies can provide valuable diversification as part of a balanced portfolio.
Concluding Comments
- In Q3, markets absorbed the first Fed rate hike since 2023, oil back above $100, and a 10-year Treasury yield at its highest level since 2002. Despite those headwinds, the S&P 500 gained +2.3% in Q3 (+12.7% YTD) and finished within about 2% of its all-time high. This year, diversification has come from commodities (+32.9%) and trend-following strategies (+15.7% for the SG CTA Index) rather than core bonds, as the Bloomberg US Aggregate was down -2.9% on the year.
- The broadening we highlighted last quarter stalled. Small caps fell roughly -6% in Q3 as rates rose, and leadership narrowed again. Energy (+17.2%) and Technology (+7.2%) led, while Utilities (-12.4%) and Industrials (-9.7%) lagged. The ten largest companies now make up 40.8% of the S&P 500. Valuations outside the largest names are lower, but a sustained broadening of returns likely requires inflation and rates to stabilize.
- The AI investment cycle continues to accelerate. More of the buildout is being financed with debt: the five largest hyperscalers issued about $238 billion of net debt over the past three quarters. With the S&P 500’s forward earnings yield now below that of the 10-year Treasury, the margin for error has narrowed further.
- Bond repricing was a drag on returns, but it also reset starting yields. The Bloomberg US Aggregate Bond Index yields 5.56%, with a real yield of 3.12%, above the long-term average of 2.48%. Intermediate-duration, high-quality bonds now offer attractive levels of income. With high-yield spreads near historic tights and CCC spreads widening, investors are not being paid to reach for lower-quality credit.
- The environment continues to favor patience, careful manager selection, and diversification beyond traditional equities and fixed income.
Disclosures
Past performance is not indicative of future results. Sage Mountain Advisors, LLC (“SMA”) is an independent SEC registered investment advisor. Any reference to or use of the terms “registered investment adviser” or “registered,” does not imply that SMA or any person associated with SMA has achieved a certain level of skill or training. This material is provided for informational and educational purposes only.
Any subsequent, direct communication by SMA with a prospective client shall be conducted by a representative that is either registered or qualifies for an exemption or exclusion from registration in the state where the prospective client resides. For more information pertaining to the registration status of SMA, please contact SMA or refer to the Investment Adviser Public Disclosure website (www.adviserinfo.sec.gov). The information contained herein should not be construed as personalized investment, tax, or legal advice. Certain information contained in this presentation has been derived from third party sources. While we believe these sources to be reliable, we make no representations as to the accuracy, timeliness, and completeness of any such information prepared by any unaffiliated third party incorporated herein, and take no responsibility therefore. As such, there is no guarantee that the views and opinions expressed in this presentation will come to pass.
All investments carry a certain degree of risk of loss, and there is no assurance that an investment will provide positive performance over any period of time. The statements contained herein reflect opinions, estimates and projections of SMA as of the date hereof, and are subject to change without notice. SMA reserves the right to modify its current investment strategies and techniques based on changing market dynamics or individual portfolio needs. The opinions expressed herein are those of SMA and are subject to change without notice. Information presented should not be considered as a solicitation or recommendation to buy or sell any security, financial product, or instrument discussed herein. Additionally, this material contains certain forward-looking statements which point to future possibilities. Due to known and unknown risks, other uncertainties and factors, actual results may differ materially from the results portrayed or implied in such forward-looking statements. Furthermore, the illustrative results presented in this presentation in no way reflect the performance of any SMA product or any account of any SMA client, which may vary materially from the results portrayed for various reasons, including but not limited to, investment objectives, financial situations and financial needs of SMA clients; differences in products and investment strategies offered by SMA; and other factors relevant to the management of SMA client accounts.
This presentation and its contents are provided “as is” without warranty of any kind, express or implied, including, but not limited to, implied warranties of merchantability, fitness for a particular purpose, title, non-infringement, security, or accuracy. SMA reserves the right to modify its current investment strategies and techniques based on changing market dynamics or client needs. It should not be assumed that any of the security transactions, holdings or sectors discussed were or will prove to be profitable, or that the investment recommendations or decisions we make in the future will be profitable or will equal the investment performance of the securities discussed herein. Actual investment advisory fees incurred by clients may vary. A complete description of SMA’s fee schedule can be found in Part 2 of its FORM-ADV which is available at www.sagemountainadvisors.com or by calling (404) 795-4861. Clients are advised that no portion of the services provided by SMA should be interpreted as legal, tax or accounting advice. For legal and tax-related matters, we recommend that you seek the advice of a qualified attorney, accountant or tax professional. SMA-24-0172