SAGE MOUNTAIN 945 East Paces Ferry Rd NE, Suite 2660, Atlanta, GA 30326
SAGE MOUNTAIN RESEARCH
Market Update – Q4 2023
Key Themes
- Returns are inherently unpredictable, especially over short time periods.
- Extend fixed income duration while continuing to hold some short duration bonds for near term cash needs.
- Stay invested at your target weight in equities and continue to overweight US. Don’t chase short term trends.
- Allocate to alternatives to increase diversification and provide additional potential sources of return. We are currently focused on opportunities in private credit, but remain open to strategies that could benefit as interest rates fall.
2023 Recommendations in Hindsight
Fixed Income
Recommendations included remaining overweight shorter duration while considering selectively adding duration due to higher interest rates and elevated recession risk
2023 highlights included the Janus Henderson AAA CLO ETF return of +8.6%, Cliffwater Corporate Lending Fund +12.7%, and Principal Street Short Duration Municipal Bond +4.3% (equivalent to about a 7.2% taxable return assuming a 40.8% tax rate).
In early November with the 10-year Treasury yield near 5%, we recommended clients extend duration to lock in yields for longer. The recommendation came near the recent peak in rates, but it could have been beneficial to start that move sooner as rates dropped significantly shortly afterwards.
Equities
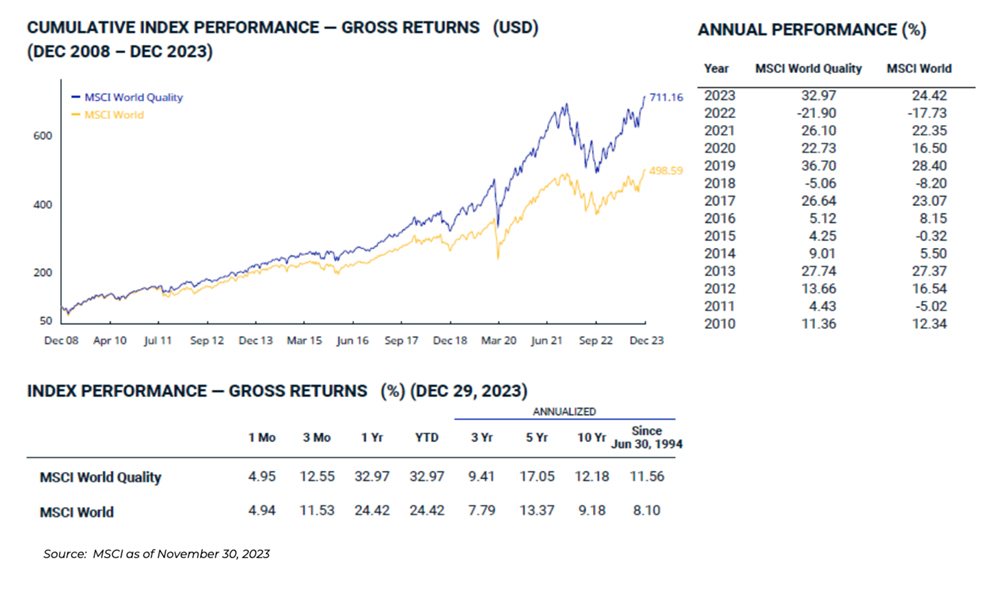
Recommendations included staying invested, maintaining a 4:1 overweight of US vs. international equities and favoring quality as a factor tilt.
Simply staying invested turned out to be the most important as global equities returned +22.2%. Our overweight to the US was beneficial as the S&P 500 returned +26.3% while the MSCI EAFE returned +18.2% on an unhedged basis and +16.2% currency hedged.
While we expected a larger boost to unhedged international returns from a weaker US dollar, it ended up being modest as the dollar index only declined -2.1%.
The quality factor was mostly neutral. We have implemented that tilt in the US via the JP Morgan US Quality Factor ETF which returned +25.1% and the iShares MSCI USA Quality Factor ETF which earned +30.8% due to its relative bias to growth stocks. On the international side, the iShares MSCI International Quality Factor ETF marginally outperformed the MSCI EAFE returning +18.5%.
Alternatives
We recommended continuing to add to alternatives to diversify risk and drive growth. We cautioned that higher debt costs could dampen near term returns in private real estate, but still believed in the long-term fundamentals for housing, industrial, and medical office. We also recommended diversified venture capital funds with fresh capital to deploy at attractive valuations, as well as secondaries funds across asset classes.
In hindsight, in a year like 2023 alternatives generally detracted from returns relative to equities which will almost always be the case when equity markets are nearly +30%.
We added secondaries exposure to funds focused on credit, real estate, and venture capital.
Within primary market real estate, we leaned towards credit, while also making a sizeable coinvestment in a veterinary office development project.
Other notable investments included an Atlanta-based growth equity fund and whiskey barrels which we believe will provide exposure that is truly uncorrelated to traditional equity and fixed income markets. We also made two direct private credit investments that were sourced through our clients.
While it is too early to judge the returns of the investments made in 2023, we are optimistic about their long-term outlook.
Stay disciplined and avoid trend chasing

Consensus forecasts were completely wrong in 2023, as
they are most years
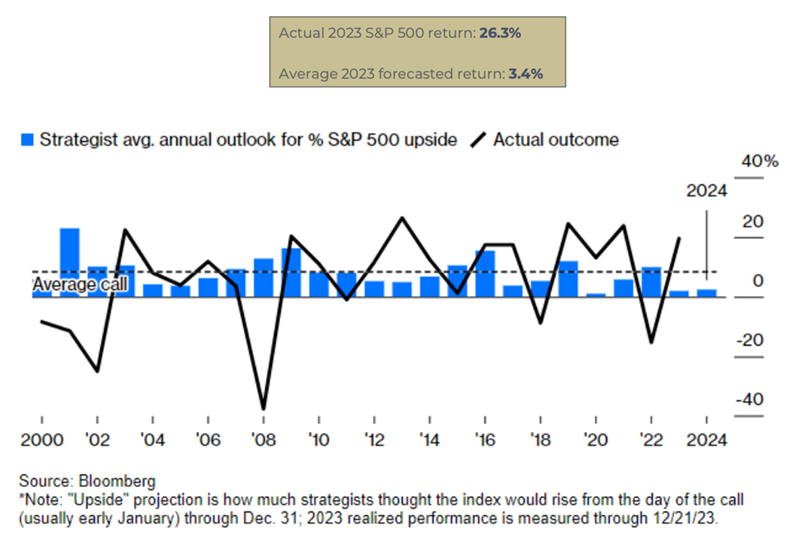
Source: Bloomberg
There was plenty to worry about…

…but 2023 defied expectations for GDP
growth…

…housing prices…

…inflation, and employment

The generative AI boom shocked the market…


…but technological progress typically happens “gradually and then suddenly”

The world’s first hard disk drive which held a whopping 3.75MB of data
And tech valuations are not in bubble territory

The Macroeconomic Setup for 2024
The pace and size of interest rate cuts remains the #1 issue in the financial markets. The most leveraged parts of the economy (banks, real estate, mortgages, consumer credit and the M&A deal ecosystem) could certainly use lower rates sooner rather than later.
Inflation is headed in the right direction, which makes “real” interest rates appear quite high, justifying a cut. At the same time, the underlying economic fundamentals look healthy, which has supported consumer spending and prevented credit problems from worsening past “normal” levels.
Overseas economies are generally weaker than recently hoped, especially the Chinese recovery. However, this may not impact the domestic markets very much – we would describe global growth as weak but not dire. Some relative economic bright spots include India and Japan.
The policy reaction to the Pandemic is making this cycle harder to predict than normal. We believe that if current trends hold it is likely that the US can achieve a soft landing.
Shifting Interest Rate Expectations
The chart shows market implied yields for 3-month SOFR futures, a proxy for the Fed Funds Rate.
Expected rates moved higher early in the year following persistently high inflation, dropped after the collapse of Silicon Valley Bank, trended back up as economic data remained solid and the “higher for longer” theme took hold, and finally fell sharply after the surprisingly dovish December Fed meeting.

Inflation Trending Positively

Globally, inflation is on the decline. According to Goldman Sachs, economies that saw a large post-COVID price surge now have inflation of 2.2% annualized over the past three months and just 1.3% in November. Central banks now have flexibility to start considering rate cuts with inflation coming down so rapidly, as evidenced by the clear change in tone at the December Fed meeting. Markets are now pricing a greater than 70% chance of a rate cut in March and virtually a 100% chance by May.
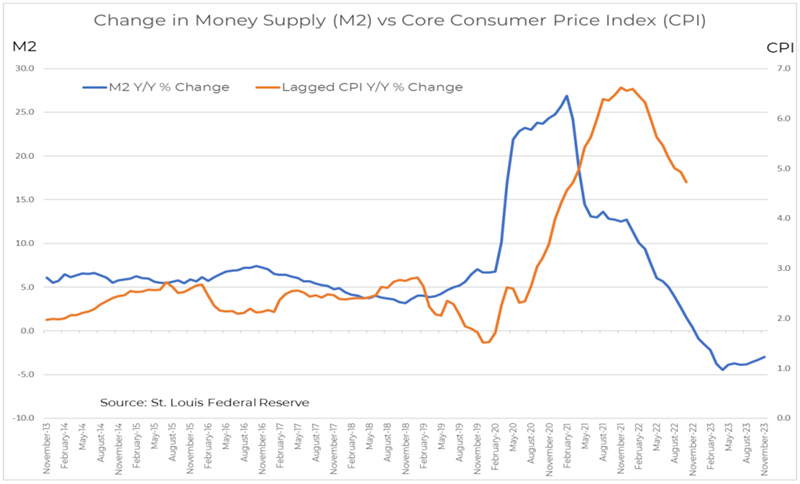
CPI tends to follow monetary policy with a lag; indeed, inflation seems set to keep falling back to pre-Pandemic levels.
Market-Derived Inflation Expectations
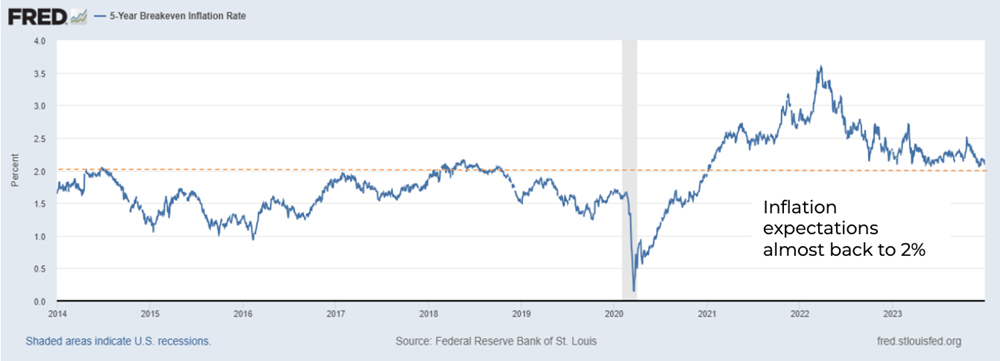
In addition to the actual inflation data, markets expectations are a critical input for Fed policy. Using
the 5-year inflation breakeven rate, we can see that expectations for future inflation continue to fall. This is further good news for the interest rate outlook.
Inflation continues to fall; will it stay on trend?
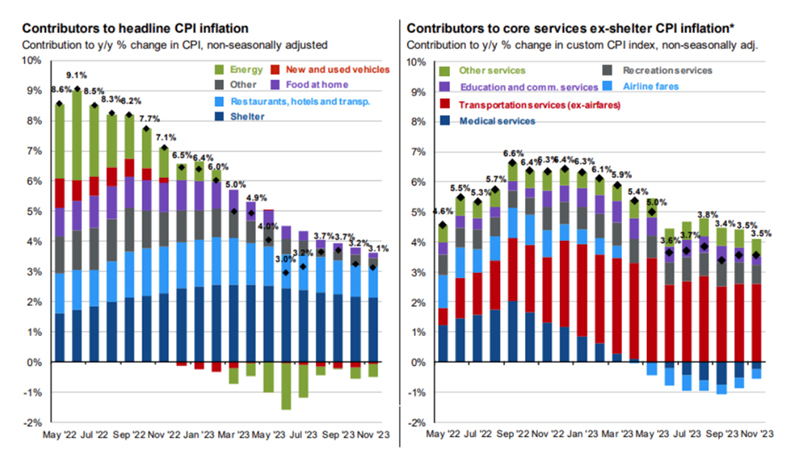
Source: BLS, FactSet, J.P. Morgan Asset Management
Looking deeper under the hood, core inflation has continued to decline after peaking in Q3 2022. The headline disinflation has been driven by reversals in energy costs since 2022 and significant slowing in vehicle prices and shelter costs. While housing transactions have dried up due to high mortgage rates, rents are now rising 2-3%, versus double digits during the Pandemic.
Importance of Rent to Overall Inflation
Housing costs (rent and mortgage payments) remain the largest piece of US consumer spending. We expect rent to continue trending down after a very sharp rise. Changes in the CPI shelter index tend to lag real time rents, indicating further disinflation ahead.
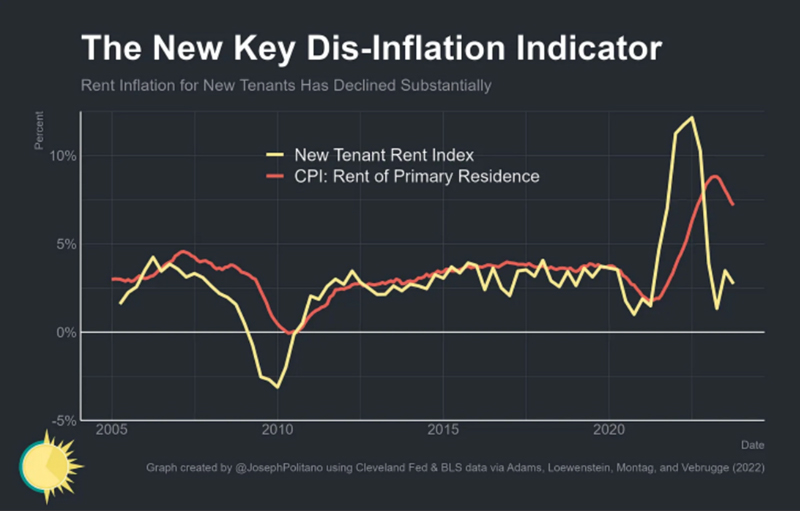
Source: Apricitas Economics, CBRE U.S. Real Estate Market Outlook, 2024
CBRE, the large real estate services firm, expects that, “the biggest wave of new apartment supply in decades will temper rent growth and improve affordability for renters in 2024. With delivery of 440,000 new units expected in 2024 and more than 900,000 currently under construction, the overall vacancy rate is expected to rise and rent growth to decelerate.”
The US is still dealing with a housing shortage
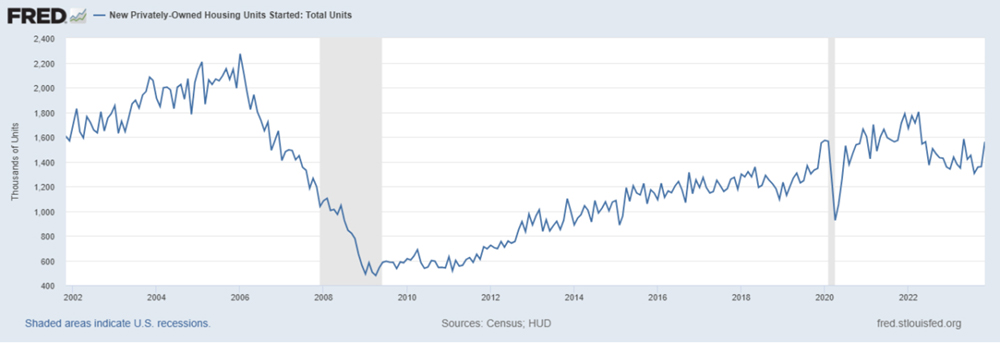
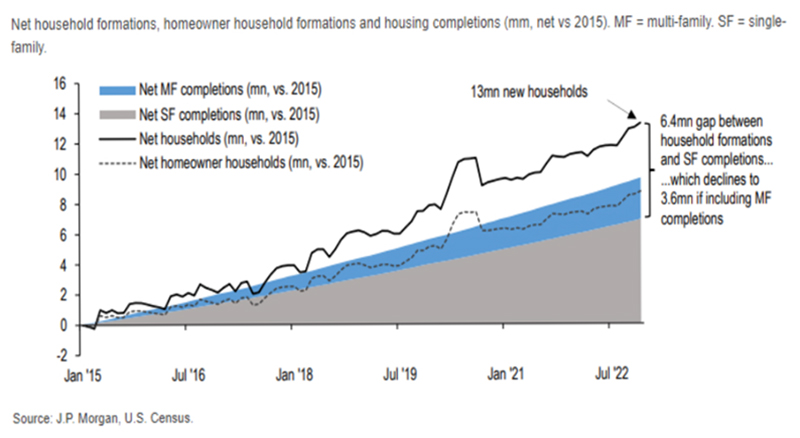
Housing construction collapsed following the Global Financial Crisis, slowly recovered into 2022, and then declined again as supply chain issues increased costs and rates for mortgage and construction loans spiked. The exact number is difficult to measure, but estimates show that the US has a shortage of millions of homes. We believe that should provide support for housing prices and benefit multifamily projects that are delivered in the next couple years.
Employment remains solid
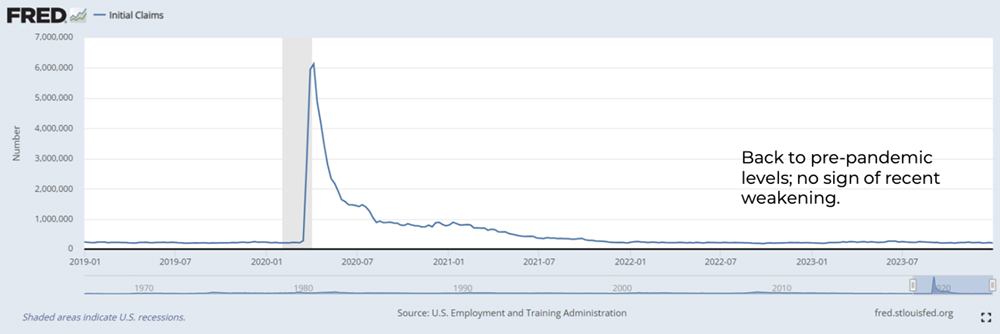
Initial unemployment claims are one of the best real-time data series we have for measuring the health of the labor market. Put simply, there is no sign that workers are being laid off in significant numbers. The labor market is cooling off, but from very elevated levels.
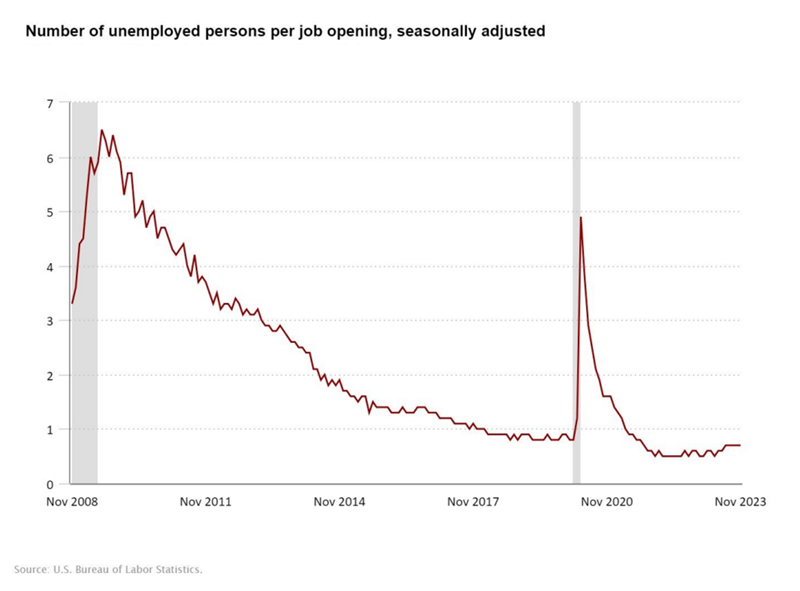
The November JOLTS reading (Job Openings and Labor Turnover Survey) showed openings, job quits, and layoffs all fell slightly in recent months.
This slight rise in the number of unemployed per open job is consistent with a gradually cooling labor market and is not an indication of significant weakness.
Income growth should support consumer spending in 2024
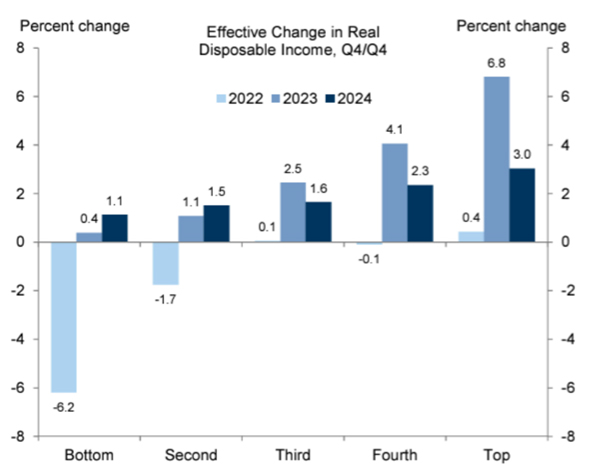
Source: Goldman Sachs
After declining in 2022, real disposable income growth rebounded in 2023 and is expected to remain positive in 2024 across all income levels.
While households spending down excess savings they accumulated during the pandemic likely boosted spending in 2021 and 2022, we believe the impact was negligible in 2023 and will remain muted going forward.
Financial Conditions
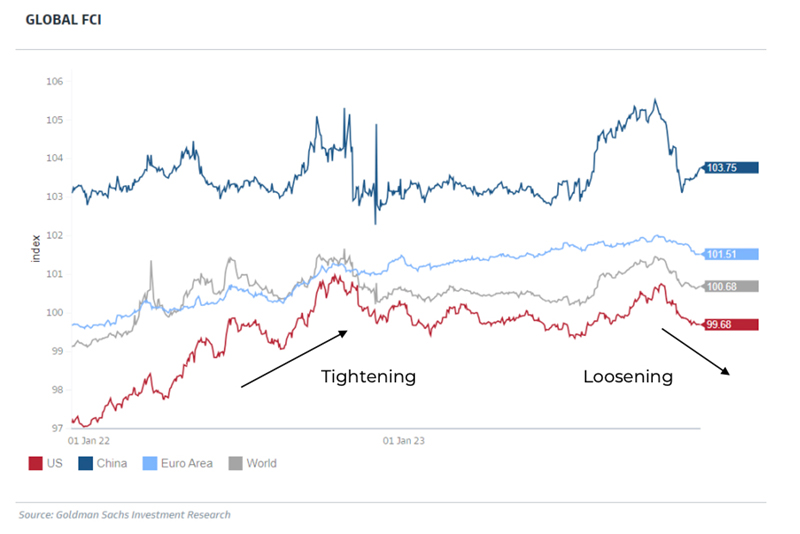
Goldman Sachs’ index of Financial conditions incorporates Fed policy, market expectations and financial institution lending. Financial markets’ belief in approaching interest rate cuts can spur activity, becoming stimulative in and of itself. One caveat, the Fed does not want “too much” easing too quickly.
Global PMIs are Healthy
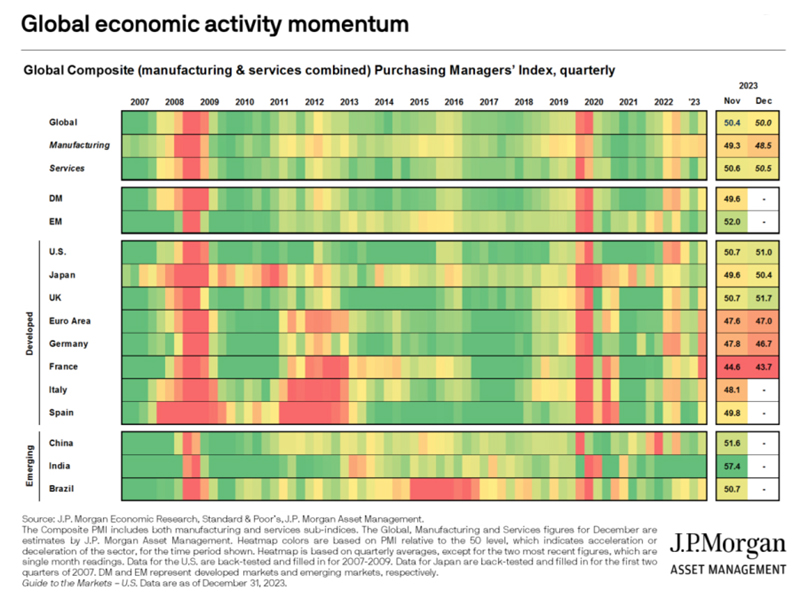
After a sharp decline during the first part of the Pandemic, a massive fiscal and monetary response resuscitated the global economy. The economy is coming off that initial burst of stimulus and the following monetary tightening to contain inflation. The world economy is right at a neutral level.
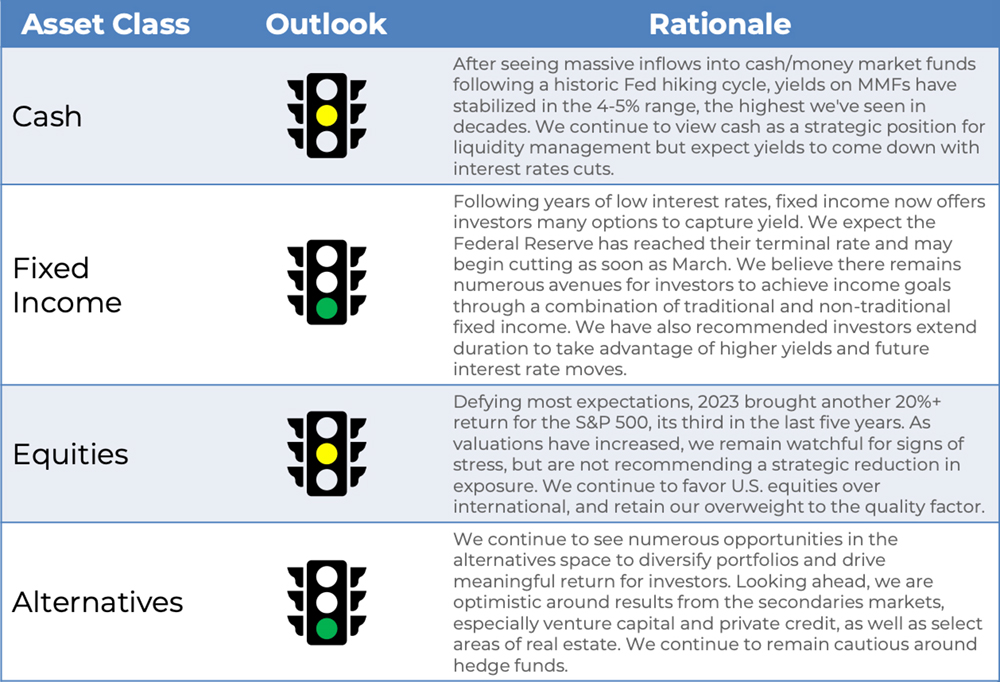
Illustrative current positioning
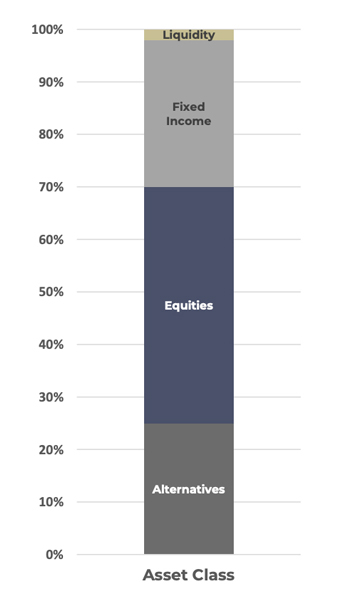 Cash (Liquidity)
- Unlike recent years, holding cash remains an attractive option. With yields on money market funds near 4.5% or higher, we strategically utilize those high yielding cash instruments to earn income while ensuring we meet clients’ liquidity needs.
Fixed Income
- Government Bonds: In the US, the Fed funds markets seem well priced for “higher for longer.” We have recommended pushing duration out to around the 5-year mark to lock in higher yields for longer.
- US Investment Grade: The strengthening economy has been supportive of credit markets, both high yield and investment grade. Spreads are tight and thus may be fully valued for now. We remain tactically allocated to AAA CLOs as they offer higher yields than investment grade corporate bonds and comparable yields to municipal bonds net of taxes.
- US High Yield & Leveraged Loans: Most analysts expect an erosion in the economy and corporate fundamentals to slightly push out spreads of higher risk credit investments. However, the economy has experienced less distress and more resiliency than expected. A continuation of that trend would likely result in tighter spreads and higher prices.
Equities
- US: Interest rates are higher and QT headwinds (central banks allowing their bond holdings to shrink) are now stronger with tightening also in Europe and Japan. Geopolitical factors have further deteriorated as well. We remain steadfast in our favor or U.S. over International stocks, as well as maintain our quality tilt. We continue our viewpoint on passive implementation within equities.
- International: While valuations for international stocks remain lower than the U.S., so do their growth prospects. Europe and the U.K. remain weak, with discouraging economic data. In China, the recovery is shaping up to be weaker than expected. For various reasons, it will be more difficult for China to spur growth through infrastructure spending which is their authorities’ preferred tool.
Alternatives
- Alternative lenders may benefit from stress at regional banks. We have seen more borrowers turn to private credit as it becomes relatively better priced and given the certainty of execution and long-term partnership. We are leaning into private real estate debt which may benefit from a similar dynamic, while becoming much more cautious on new real estate equity commitments which will need to overcome borrowing costs that have increased more than cap rates. The slowdown in venture capital fundraising and deals may make this upcoming cycle a good time to participate in the sector. We also believe secondaries funds across strategies are well positioned to capitalize on the current environment.
Market Snapshot
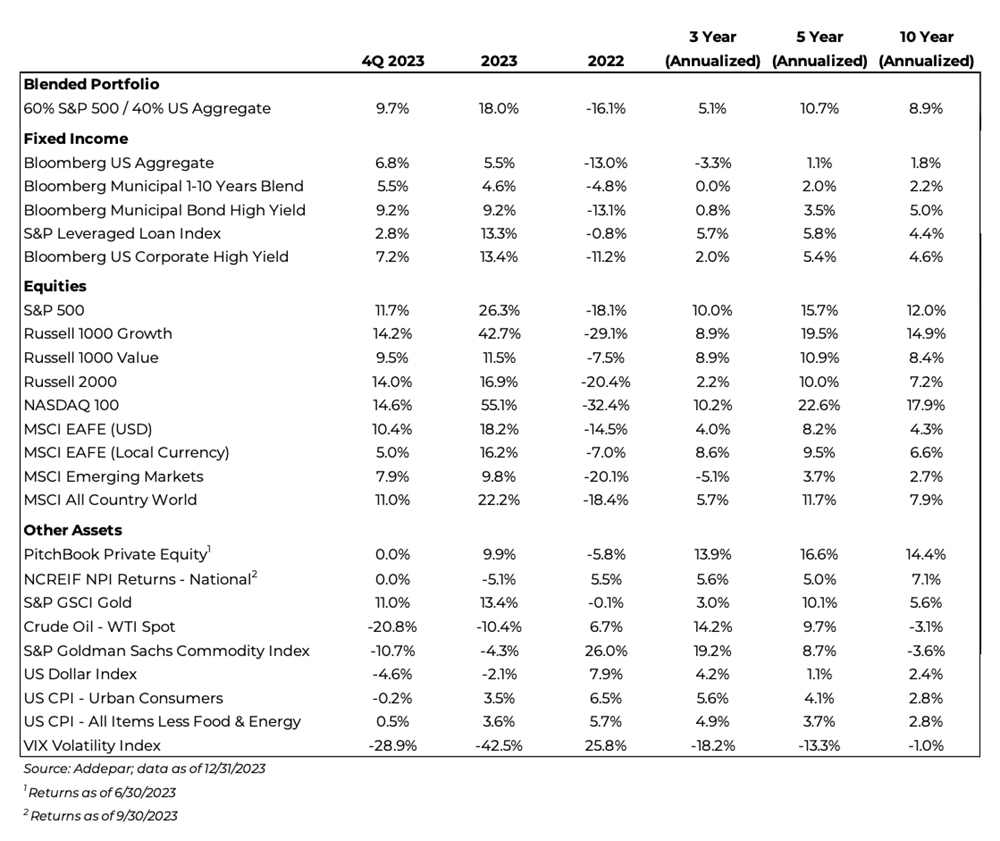
In a stark reversal from Q3, Investment grade fixed income rose in Q4 as rates fell broadly, while high yield outperformed as credit spreads remained tight.
Equities outpaced expectations in the fourth quarter as broad indices climbed. The S&P 500 rose 11.7%, while international stocks were up 10.4%.
On the back of concerns in the Middle East, oil fell sharply in Q4 down –20.8%. The US Dollar reversed from Q3, falling 4.6% in the fourth quarter and dragging its year-to-date return negative.
Volatility fell sharply in Q4 as investor worries waned, bringing 2023 volatility to a staggering low, with the VIX down -42.5%.
A 60% equity / 40% bond portfolio rose in Q4, posting a 9.7% return as both stock and bond markets soared.
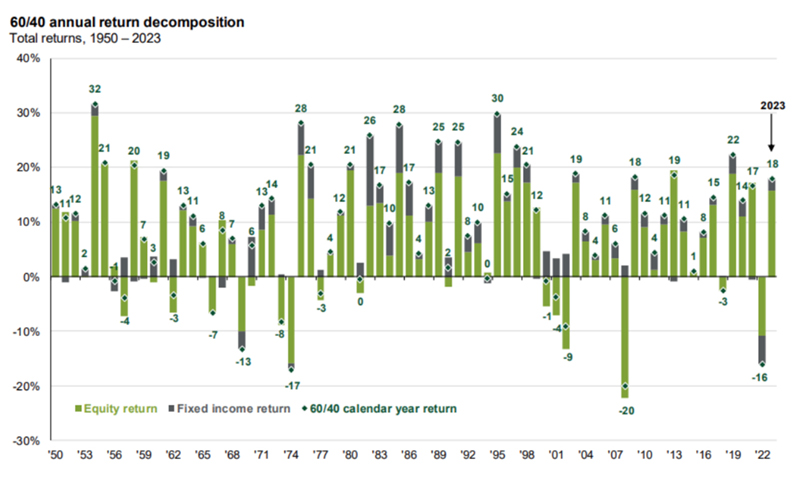
Is the 60/40 back? Not that it went anywhere…
Perhaps the most classic of all portfolios, the 60/40 (60% stocks / 40% bonds) experienced its worst year in 2022 since the Global Financial Crisis. However, after starkly negative years for both stocks and bonds in 2022, both reversed course in 2023 with stocks accounting for about 87% of the portfolio return and bonds being additive following a fall in rates in the second half of the year. The 60/40 portfolio has only produced 3 negative years in the last 20 with 2023’s performance.
Source: J.P. Morgan Asset Management
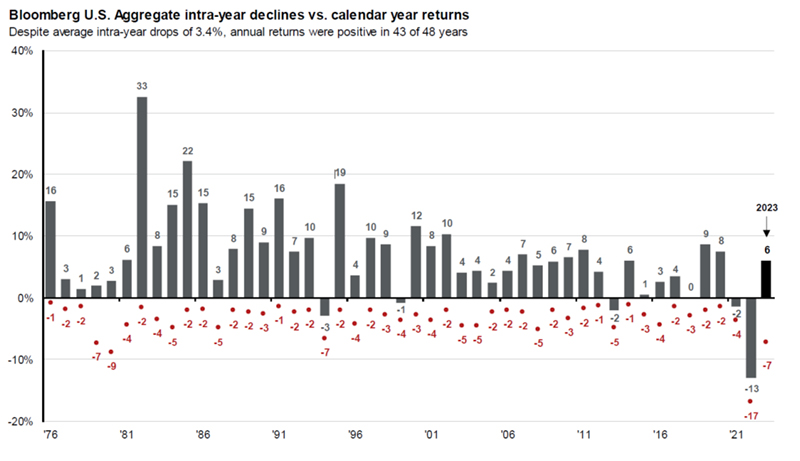
Bonds Bounce Back
After the worst year for fixed income in over 40 years, bonds bounced back in 2023 with broad positive returns. After 2022, where the US Aggregate Bond Index was down -12.3%, broad fixed income rose during 2023 on the back of tighter spreads, falling yields, and dissipating concerns around future interest rate hikes. Coming into the fourth quarter, core bonds (IG credit and Treasuries) were flat to slightly negative, but thanks to a fourth quarter rally, the US Aggregate Bond Index ended up 5.5% for 2023. Leading the asset class were US Corporate High Yield (13.4%) and Leveraged Loans (+13.3%).
Source: Addepar, FactSet, Bloomberg, J.P. Morgan Asset Management
Higher rates support extending duration
With interest rates increasing to their highest levels since prior to the Global Financial Crisis, we have recommended extending from short to intermediate duration. As shown in the table to the right, the risk/reward trade-off has shifted in support of going out further on the maturity curve.
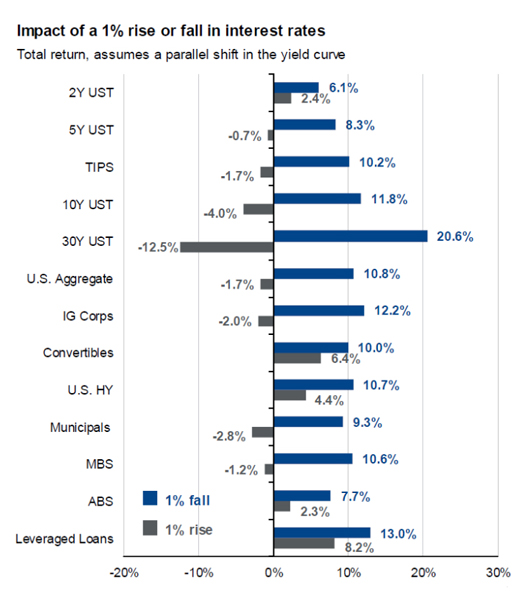
Source: Bloomberg, FactSet, Standard & Poor’s, U.S. Treasury, J.P. Morgan Asset Management
After being starved for years, investors can access yield in a variety of places.
After years of unattractive bond yields, easy monetary policy, and investors searching for income… investors find themselves with an abundance of options to choose from. The rapid escalation in rates by the Federal Reserve has given light to yields that haven’t been seen in over a decade. With Money Market Funds yielding 5%+ during 2023, to direct lending being able to access low double-digit yields, income for the investor is now a driving force of any investment portfolios.
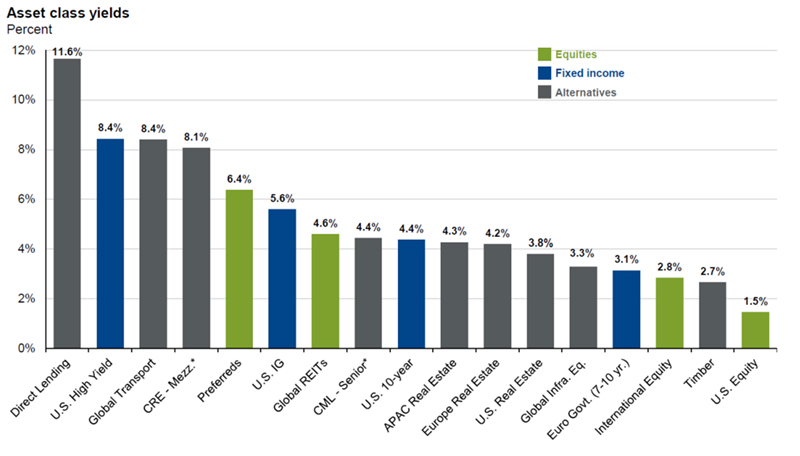
Source: BAML, Bloomberg, Clarkson, Cliffwater, Drewry Maritime Consultants, Federal Reserves, FTSE, MSCI, NCREIF, FactSet, Wells Fargo, J.P. Morgan Asset
Management.
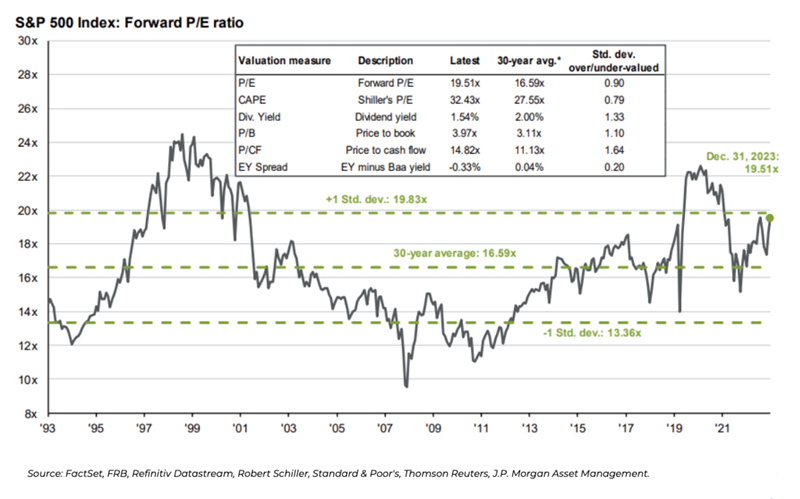
In this context valuations are above average but not
unreasonable.
2024 earnings expectations have stabilized
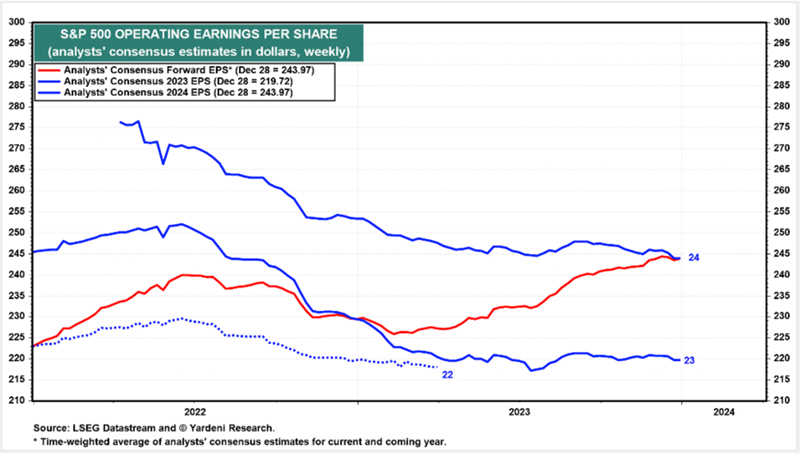
Source: Yardeni Research
Analysts forecast a small gain for the S&P 500 in 2024,
but that’s impossible to predict
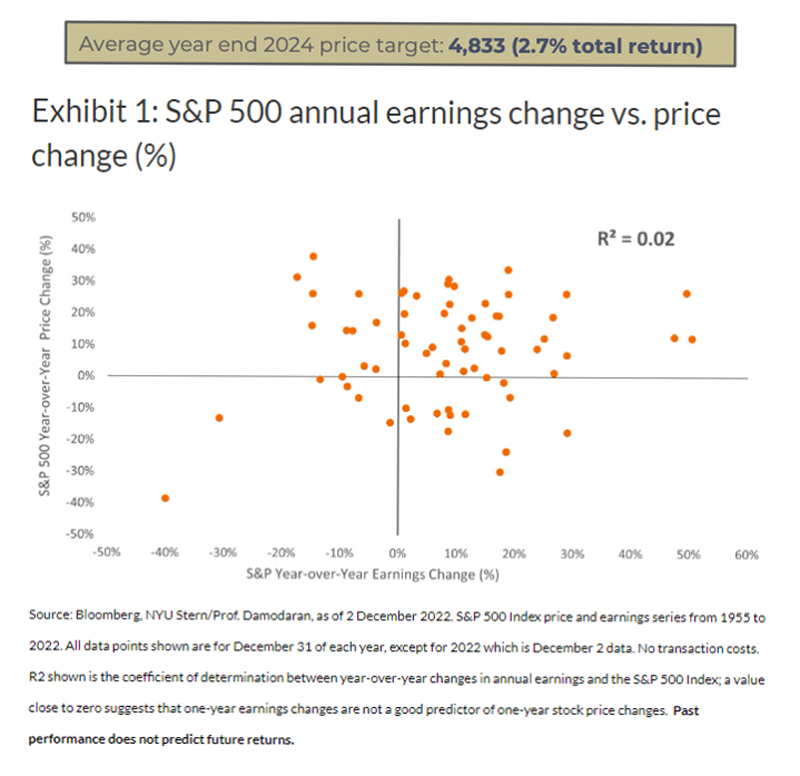
Analysts forecast a small gain for the S&P 500 in 2024,
but that’s impossible to predict
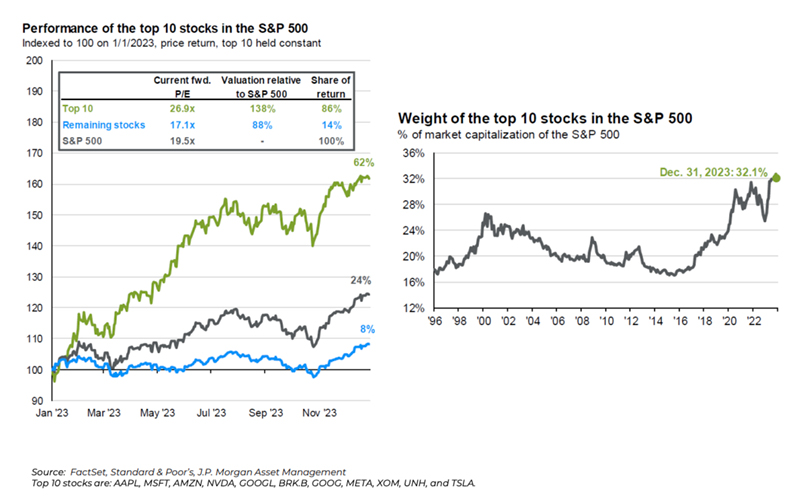
Top heavy equity performance
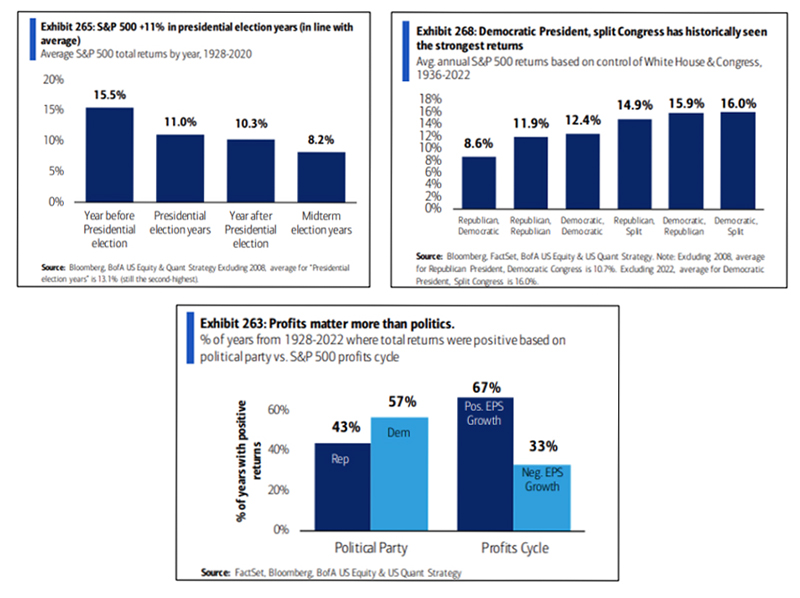
Market Performance During Election Years
Investors are typically better served by minimizing their use of political analysis. According to Bank of America, profits have been a far more significant driver of S&P 500 returns than which party is in power.
The average S&P 500 return in presidential election years is 11%, in line with the historical average.
Gridlock / split Congress has been the best backdrop for stocks, potentially because the likelihood of no changes to status quo removes uncertainty. In these regimes, S&P 500 annual returns averaged 16%.
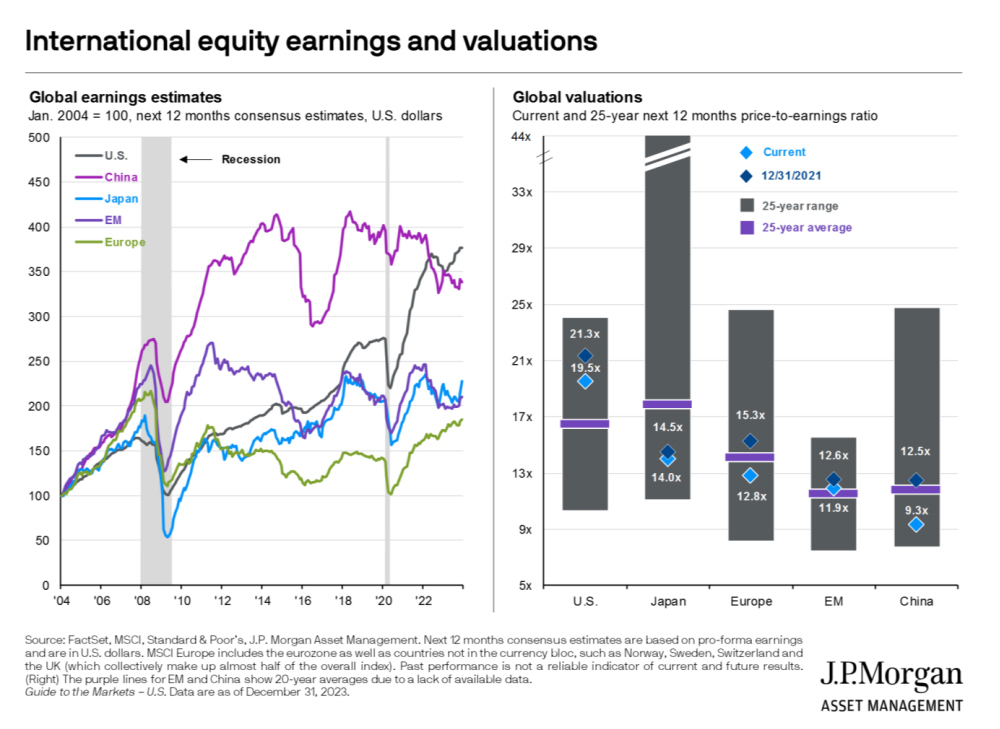
U.S. vs International
Is “Quality” still quality in equities?
The quality factor in investing refers to the tendency of high-quality stocks with typically more stable earnings, stronger balance sheets and higher margins to outperform low-quality stocks, over a long-time horizon. Research has shown that quality companies, those with higher ROE, lower leverage, and more sustainable cashflows and earnings, outperform lower quality companies over time.
Alternatives offer alternative solutions
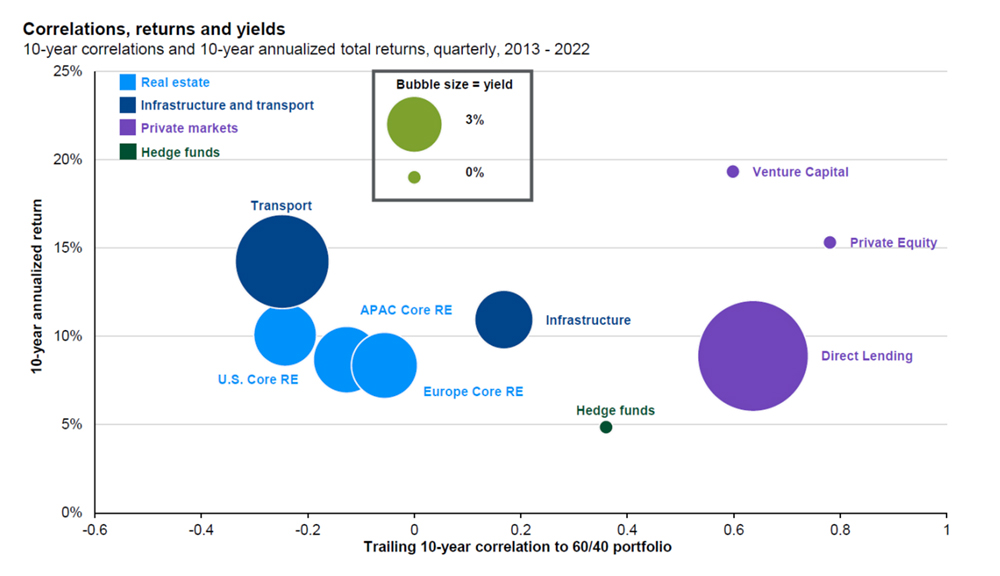
Source: Burgiss, Cliffwater, Gilberto-Levy, HFRI, MSCI, NCREIF, FactSet, J.P. Morgan Asset Management. Correlations based on quarterly returns. 60/40 portfolio is comprised of 60% S&P 500 Total Return Index and 40% Bloomberg U.S. Aggregate Total Return Index.
Manager selection continues to be paramount…especially in private markets.
Manager selection in public markets is always important, but it is crucial in private markets. This drives our philosophy to invest mostly passively within our public market allocations while focusing more on sourcing and analyzing opportunities in the private markets.
The return dispersion, as illustrated below, between the top and bottom quartile private fund managers over the last 10-years is vastly larger versus public markets. Given the illiquid nature, lack of public information, and longer time horizon, private markets require strict and thorough due diligence to select best in class managers for investments.
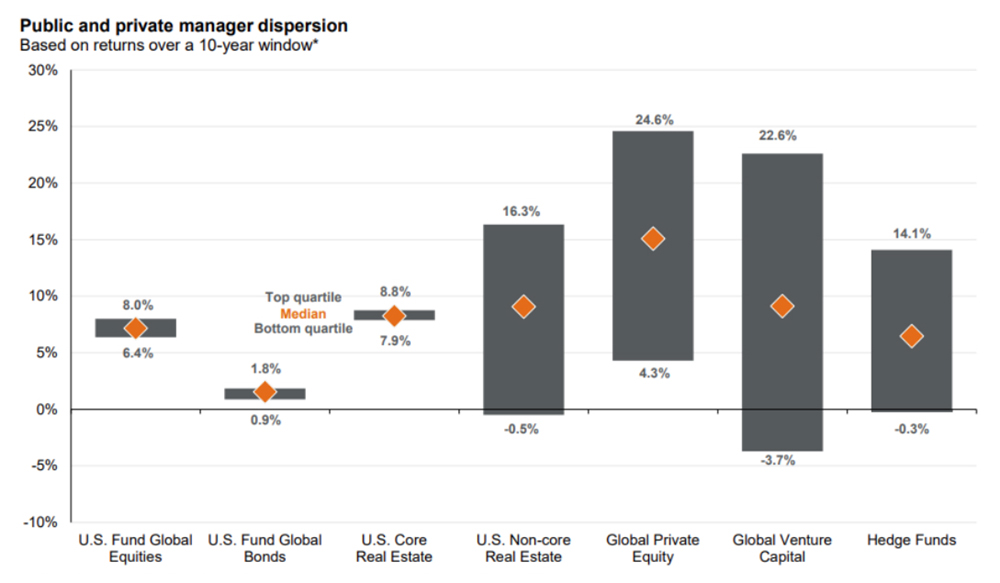
Source: Burgiss, Morningstar, NCREIF, PivotalPath, J.P. Morgan Asset Management
Where do we go from here?
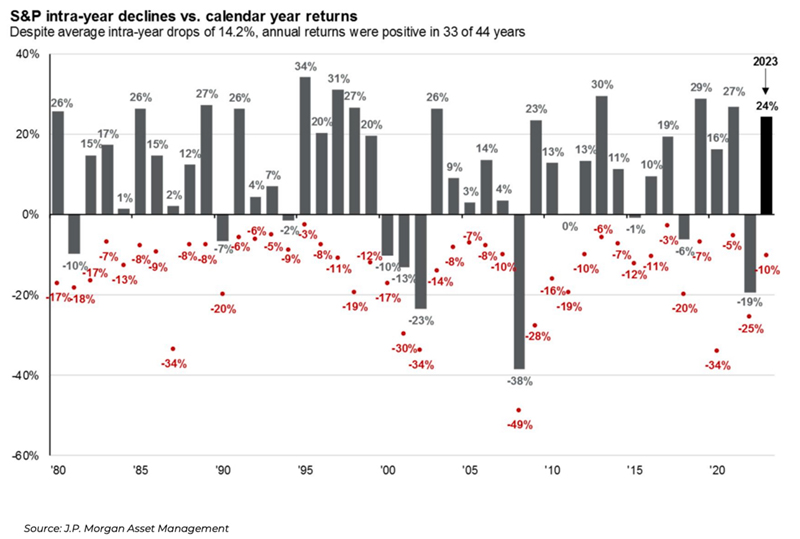
Drawdowns are frequent and should be expected, even in good years
The cost of timing the market can be steep
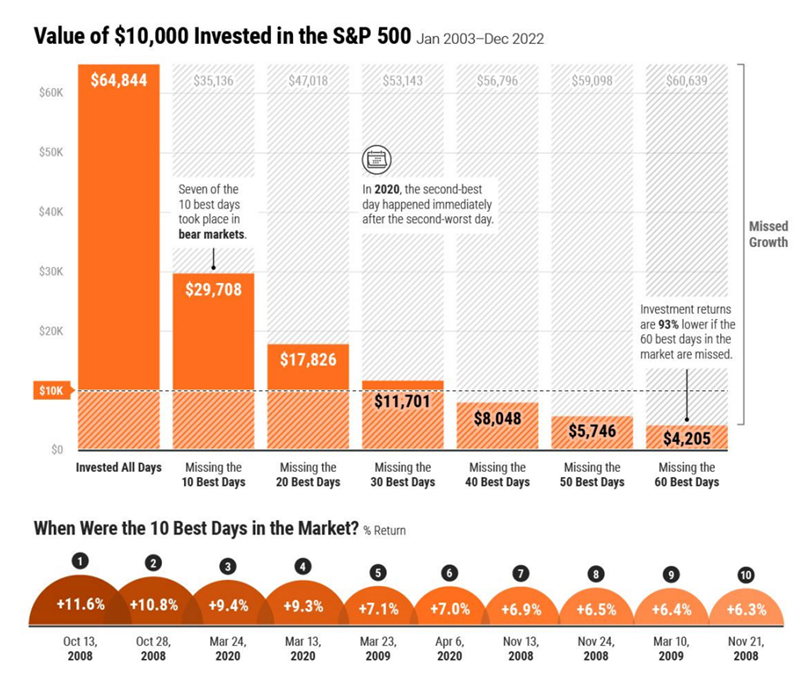
Source: Visual Capitalist
And a small number of stocks drive market returns
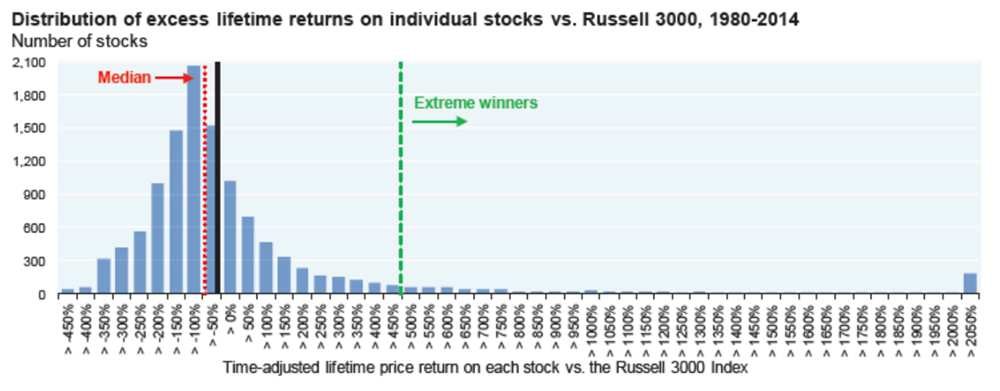
Source: J.P. Morgan Asset Management
“The first rule of compounding: Never interrupt it
unnecessarily.” – Charlie Munger
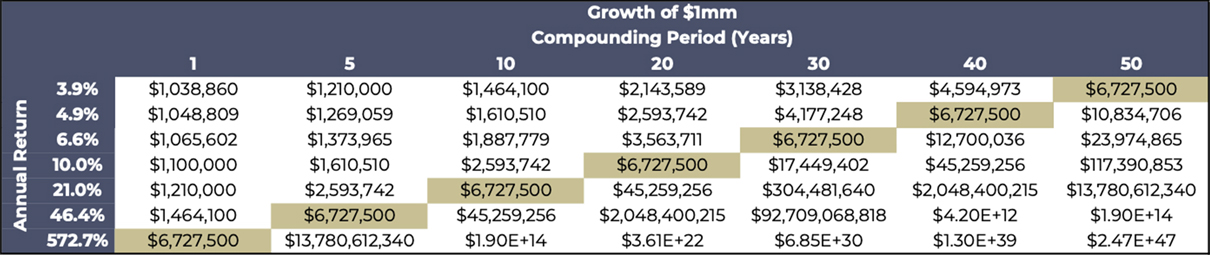
This table shows the growth of $1,000,000 over various time periods. The highlighted numbers show the return
an investor needs to earn over various periods to equal a 10% annual return compounded over 20 years.
Estate and Gift Tax Planning Opportunities
Absent any action by Congress and the President, the increased Lifetime Unified Gift and Estate Tax Exemption is scheduled to sunset two years from now. On January 1, 2026, the credit will be reduced from the current $13,610,000 per person to approximately $7,000,000 and the estate tax rate will increase from 40% to 45%. Additionally, many of the provisions of the Tax Cuts and Jobs Act (TCJA) will expire as well. This means higher income tax rates and a lower Standard Deduction.
The Exemption amount is “use it or lose it,” meaning anyone who has previously created an estate plan should consider “topping off” any Trusts to fully utilize the higher Exemption amounts before they go down in 2026. We anticipate the exclusion amount will increase again in 2025 to the low $14mm range. The annual gift tax exclusion (independent of the lifetime exclusion) is now $18,000 per person per year. Consider making annual gifts early in the year. Creating and implementing a proper plan requires coordination between Sage Mountain and other professionals (attorneys, CPA’s, etc) and a significant amount of time. Anyone without a current estate plan should start that process with us as soon as possible before the rush to get them done before the end of 2025 begins.
Super-funded 529 Plans are also a great planning opportunity. This strategy allows a taxpayer to front-load 5-years worth of annual exclusions ($18,000 x 5) to get $90,000 out of their estate without dipping into their lifetime exemption. The spouse can do the same, resulting in a total of $180,000 going into the 529 Plan. Anyone who has used this strategy in previous years when the annual exclusion amount was lower should remember to consider “toping off” up to the new $18,000 limit. Any amounts not used by the original beneficiary can be transferred to other family members or used as a “Dynasty 529.”
There is also a new provision within the Secure Act 2.0 allowing unused 529 Plan money to potentially be rolled over to a Roth IRA. The rules for this provision are complex and have not been fully finalized by the IRS. Reach out to your Sage Mountain advisor for more details on this.
Disclosures
Past performance is not indicative of future results. Sage Mountain Advisors, LLC (“SMA”) is an independent SEC-registered investment advisor. Any reference to or use of the terms “registered investment adviser” or “registered,” does not imply that SMA or any person associated with SMA has achieved a certain level of skill or training. This material is provided for informational and educational purposes only.
Any subsequent, direct communication by SMA with a prospective client shall be conducted by a representative that is either registered or qualifies for an exemption or exclusion from registration in the state where the prospective client resides. For more information pertaining to the registration status of SMA, please contact SMA or refer to the Investment Adviser Public Disclosure website (www.adviserinfo.sec.gov). The information contained herein should not be construed as personalized investment, tax, or legal advice. Certain information contained in this presentation has been derived from third-party sources. While we believe these sources to be reliable, we make no representations as to the accuracy, timeliness, and completeness of any such information prepared by any unaffiliated third party incorporated herein, and take no responsibility therefore. As such, there is no guarantee that the views and opinions expressed in this presentation will come to pass.
All investments carry a certain degree of risk of loss, and there is no assurance that an investment will provide positive performance over any period of time. The statements contained herein reflect opinions, estimates, and projections of SMA as of the date hereof, and are subject to change without notice. SMA reserves the right to modify its
current investment strategies and techniques based on changing market dynamics or individual portfolio needs. The opinions expressed herein are those of SMA and are subject to change without notice. Information presented should not be considered as a solicitation or recommendation to buy or sell any security, financial product, or instrument discussed herein. Additionally, this material contains certain forward-looking statements which point to future possibilities. Due to known and unknown risks, other uncertainties, and factors, actual results may differ materially from the results portrayed or implied in such forward-looking statements. Furthermore, the illustrative results presented in this presentation in no way reflect the performance of any SMA product or any account of any SMA client, which may vary materially from the results portrayed for various reasons, including but not limited to, investment objectives, financial situations and financial needs of SMA clients; differences in products and investment strategies offered by SMA; and other factors relevant to the management of SMA client accounts.
This presentation and its contents are provided “as is” without warranty of any kind, express or implied, including, but not limited to, implied warranties of merchantability, fitness for a particular purpose, title, non-infringement, security, or accuracy. SMA reserves the right to modify its current investment strategies and techniques based on changing market dynamics or client needs. It should not be assumed that any of the security transactions, holdings, or sectors discussed were or will prove to be profitable, or that the investment recommendations or decisions we make in the future will be profitable or will equal the investment performance of the securities discussed herein.
Actual investment advisory fees incurred by clients may vary. A complete description of SMA’s fee schedule can be found in Part 2 of its FORM-ADV which is available at www.sagemountainadvisors.com or by calling (404) 795-4861. Clients are advised that no portion of the services provided by SMA should be interpreted as legal, tax or accounting advice. For legal and tax-related matters, we recommend that you seek the advice of a qualified attorney, accountant, or tax professional. SMA-23-000372