SAGE MOUNTAIN 945 East Paces Ferry Rd NE, Suite 2660, Atlanta, GA 30326
SAGE MOUNTAIN RESEARCH
Market Update – Q2 2023
Economic and markets performance was better than expected in the second quarter
The first half of 2023 was, in many ways, the mirror image of 2022. Inflation has declined sharply. Recession fears have waned. Growth stocks have dramatically outperformed value. Mega cap and tech stocks have led the broader market. Credit spreads have tightened.
Developed market economies, led by the U.S., have proven surprisingly resilient in the face of higher interest rates and various shocks. While most economists still forecast a recession in the next 12 months, the expected start of the slowdown keeps getting pushed futher out.
Equity markets generated very strong returns with the S&P 500 up nearly 9% in the second quarter and 17% in the first half. Mega cap technology stocks drove returns with the NASDAQ 100 up 15% in Q2 and nearly 40% so far this year. It’s not just a US story either, with international equities up 3% in Q2 and 12% on the year. Analysts proved too pessimistic about near-term earnings, and an explosion of interest in AI boosted markets.
Stock market gains have been largely concentrated in the “Magnificent Seven” tech stocks (Apple, Amazon, Alphabet, Meta, Microsoft, Nvidia, and Tesla) that may need to broaden to make for more sustainable gains.
The large, narrow returns have caused many pundits and people we speak with to question whether we’re due for a pullback. As we’ll show later, similar conditions have historically been followed by positive returns over the following 6 and 12 months.
Interest rates moved higher during the quarter as the Fed remained resolute in its goal to drive down inflation. This resulted in investment grade government and corporate bonds falling slightly, while higher yield bonds rose on the improving economic outlook.
In the face of uncertainty, alternative investments continue to hold investor attention. Non-office real estate, private debt (as banks remain cautious about lending), venture funds investing in a constrained capital landscape, and secondaries funds that are positioned to offer liquidity to wary investors represent potential opportunities in our view.

Investment grade fixed income was down modestly in Q2 as rates rose slightly, while high yield outperformed as credit spreads tightened.
Equities continued their historic first half pace, with U.S. large cap growth stocks soaring 29% during the first half while value lagged in a reversal of last year.
After rising for most of 2022, falling oil prices led a decline in commodities. The US Dollar was muted, returning 0.4% in the second quarter, but is still negative for the calendar year.
Volatility as measured by the VIX Index reached its lowest level since January 2020.
A 60% equity / 40% bond portfolio continued its run in Q2, posting a 4.9% return fueled by strong equity market returns.
Illustrative current positioning and asset class views
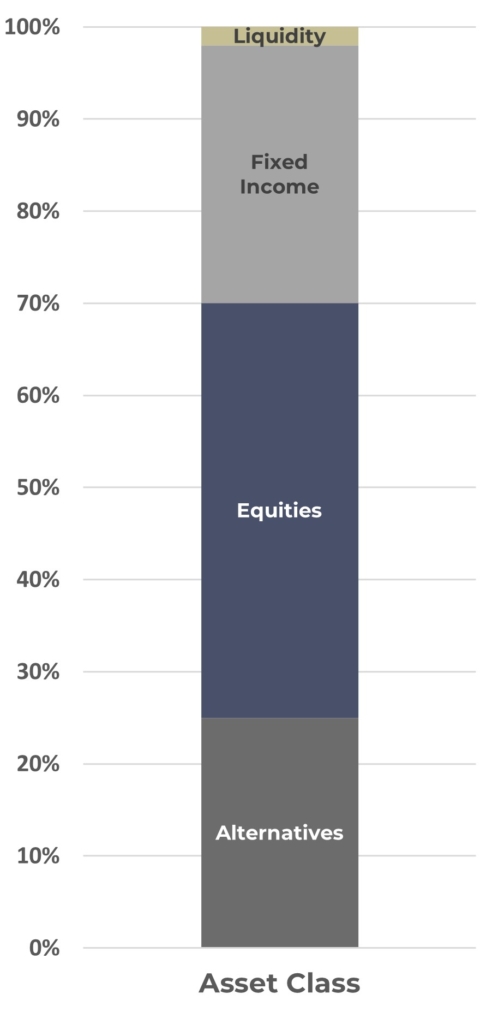
Cash
- Unlike recent years, holding cash is now a much more attractive option. With yields on money market funds near 5.00% or higher, we strategically utilize those high yielding cash instruments to earn income while ensuring we meet clients’ liquidity needs.
Fixed Income
- Government Bonds: We see modest room for yields to decline in the second half. The path of inflation and the strength of overseas economies (and thus their interest rates and currencies) will probably be the swing factor here. We expect the yield curve to steepen as we reach the end of the Fed’s current tightening cycle.
- US Investment Grade: In terms of valuation, the current level of credit spreads is right around the 10yr average. The bullish scenario would be falling inflation, moderate but positive GDP growth, and low volatility overall. A deeper recession is the most obvious potential negative factor. We are tactically allocated to AAA CLOs as they offer higher yields than investment grade corporate bonds and comparable yields to municipal bonds net of taxes.
- US High Yield & Leveraged Loans: Most analysts expect an erosion in the economy and corporate fundamentals to slightly push out spreads of higher risk credit investments. However, the economy has experienced less distress and more resiliency than expected. A continuation of that trend would likely result in tighter spreads and higher prices.
Equities
- US: We expect a weaker second half for stocks this year relative to the strong first half returns as consumers reduce spending and delayed corporate investments start to bite. However, market momentum is strong, and there is a pronounced tendency for a strong first half to be followed by a positive second half for stocks. Further spending on AI is likely to favor the U.S. on a relative basis.
- International: While valuations for the international stocks remain lower than the U.S., so do their growth prospects. Monetary tightening typically works with a lag, and Europe and the U.K. seem behind in their inflation battle. In China, the recovery is shaping up to be weaker than expected. For various reasons, it will be more difficult for China to spur growth through infrastructure spending, which is their authorities’ preferred tool.
Alternatives
- Alternative lenders may benefit from stress at regional banks. We expect more borrowers to turn to private credit as it becomes relatively better priced and given the certainty of execution and long-term partnership. Private real estate debt may benefit from a similar dynamic, while real estate equity will need to overcome borrowing costs that have increased more than cap rates. The slowdown in venture capital fundraising and deals may make this upcoming cycle a good time to participate in the sector. We also believe secondaries funds across strategies are well positioned to capitalize on the current environment.
The U.S. economy proved more resilient than many anticipated in the first half of 2023…
Stronger-than- expected economic data and resilient corporate earnings have supported markets and pushed expectations for a U.S. recession out to at least 2024. Despite a rosier start to the year, the consensus outlook for the economy going forward is still for slow growth, as the tightening in credit conditions will likely pose a greater headwind to economic activity in the quarters ahead. The consumer has held up remarkably so far, but the resumption of student loan payments and the depletion of savings may lead to more conservative consumer spending ahead.
While the consensus forecast probability of a recession in the next 12 months remains elevated at 65%, Goldman Sachs economists have reduced their estimated odds to 25%.

…while inflation continues to cool

After 2021-2022 saw continued stress on consumers and businesses from hot inflation, a sustained downtrend has continued throughout the first six months of 2023.
There are key differences in 2023 relative to the rising and sustained inflation experience in 2021 and 2022:
- Year-over-year headline inflation has fallen from a peak of 8.9% in June 2022 to 3.1% in June 2023, while core inflation has dropped to 4.9% from a peak of 6.7%.
- Energy prices continued their downward slide since Russia’s invasion, despite summer demand increasing.
- China’s reopening has provided some relief to supply chains globally, but their reemergence comes with caution.
- Inflation measures based on current market rents—a better indicator of current levels of inflation—show even further progress towards the Fed’s 2% target
The housing market is clearly recovering…
Pandemic-era low rates encouraged households to lock in cheap mortgages, which in turn has significantly reduced the inventory of existing homes for sale and supported housing prices. Combined with an ongoing shortage of single-family homes, this lack of availability has encouraged homebuilders to restart building, as the charts below show. One risk is that tight housing keeps the Fed vigilant for inflation for longer than would otherwise be the case, but we believe the Fed sees rental price growth returning to normal.

…although we have yet to see the full impact of a potential credit crunch
Even before the regional bank crisis, credit conditions had been on a tightening trend. Banks are navigating two major issues. First, fears of economic slowdown, particularly the impact of higher office vacancy on outstanding real estate loans. Second, the significant need to conserve capital to offset losses on long duration securities, worsened by the flight of deposits to higher yielding money market funds and larger banks. This decline in credit availability is coming on the heels of a significant drawdown in personal savings from government transfers during the pandemic.

Expected short term interest rates have stabilized, but are now expected to remain “higher for longer”
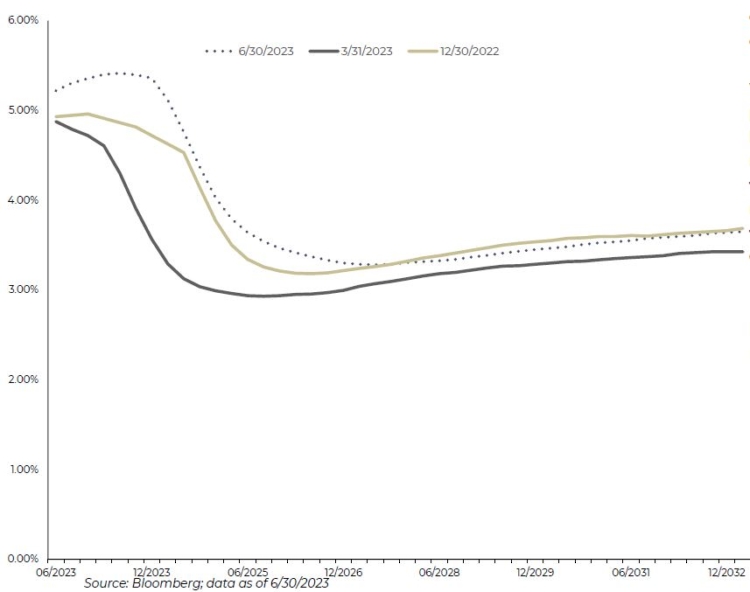
The chart shows market-implied yields for 3-month SOFR futures, a proxy for the Fed Funds Rate. The market is now pricing in one more Fed rate hike of 0.25%. The expected peak rate has increased by about 0.5% vs. the market’s expectation coming into the year and at the end of the first quarter.
While futures had previously been pricing in multiple rate cuts before year-end, as the Fed has maintained a hawkish tone short-term rates are now expected to remain “higher for longer” with the first cut not happening until Q1 2024.
Longer-term expectations have been more stable, hovering in a range of about 3.5% to 3.75%.
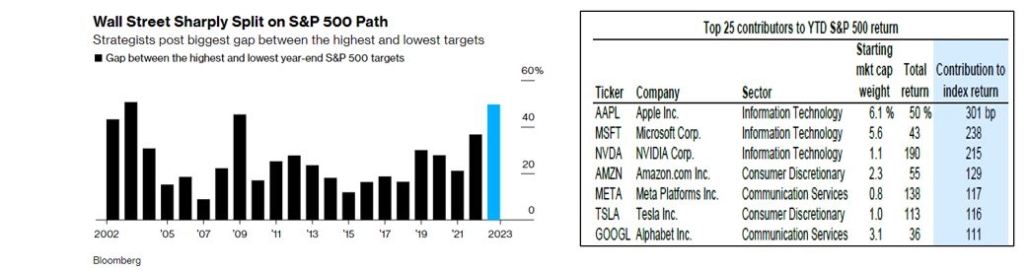
Forecasters are split on where equity markets go from here…
The S&P 500 returned 16.9% in the first half of 2023, but concerns remain due to increasing valuations and just a handful of stocks leading the rally. According to Bloomberg, the gap between strategists’ S&P 500 price targets is at the widest level in 20 years. Nearly 15% of the return came from multiple expansion from 16.8x to 19.1x forward earnings while earning growth and dividends contributed about 1% each, and over 70% of the index return was driven by 7 stocks. The index was led by Information Technology (+43%) while Energy (-6%) dragged on performance. Profit margins rose from the previous quarter, indicating that companies have had success in defending margins.
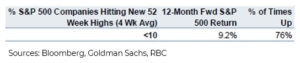
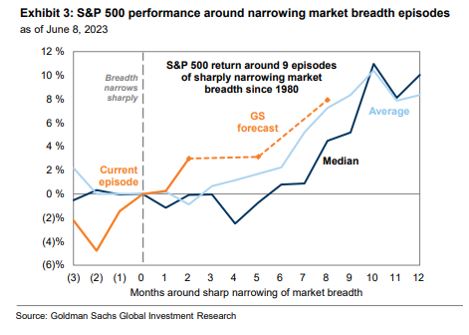 Many analysts believe the market needs to broaden out to other sectors and smaller capitalization stocks to increase confidence in its sustainability. However, research from both RBC and Goldman Sachs indicates that the S&P 500 generates positive returns on average in the 12 months following periods of narrow market breadth.
…but strong first half returns for equities are usually followed by above average returns over the remainder of the year
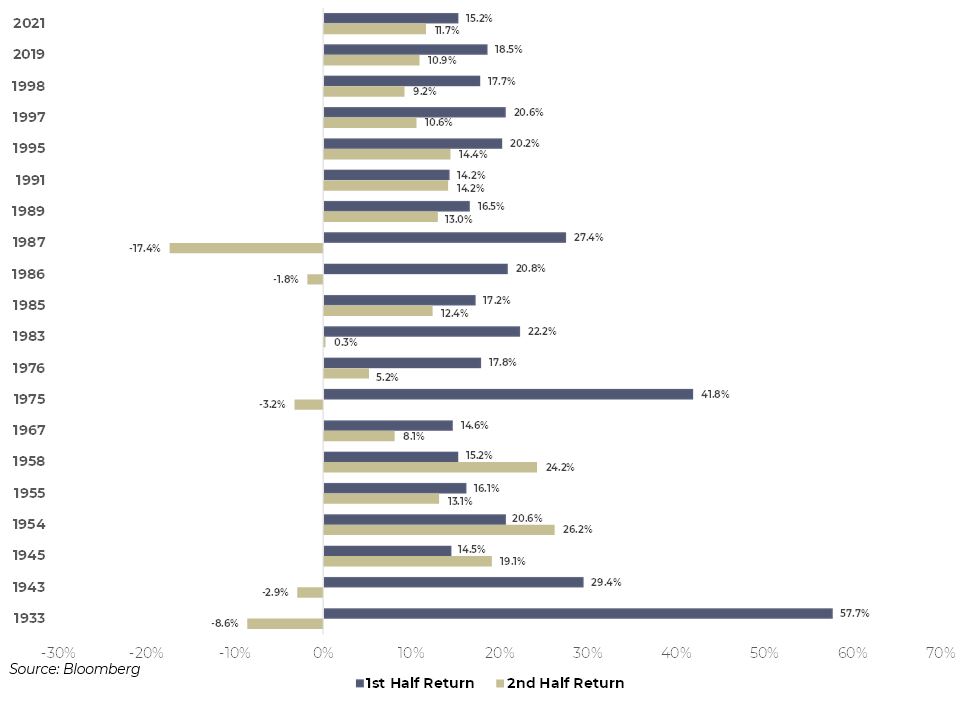
Since 1928, the S&P 500 has returned >14% in the first half 20 times. The second half return has averaged 7.9% in those years vs. an average of 6% in all years.
Second half returns have been positive in 15 out of those 20 years. The largest second half loss was -17.4% driven by Black Monday in 1987, the second largest was -8.6% during the Great Depression in 1933, and the third largest was just -3.3% in 1975.
Disclosures
Past performance is not indicative of future results. Sage Mountain Advisors, LLC (“SMA”) is an independent SEC-registered investment advisor. Any reference to or use of the terms “registered investment adviser” or “registered,” does not imply that SMA or any person associated with SMA has achieved a certain level of skill or training. This material is provided for informational and educational purposes only.
Any subsequent, direct communication by SMA with a prospective client shall be conducted by a representative that is either registered or qualifies for an exemption or exclusion from registration in the state where the prospective client resides. For more information pertaining to the registration status of SMA, please contact SMA or refer to the Investment Adviser Public Disclosure website (www.adviserinfo.sec.gov). The information contained herein should not be construed as personalized investment, tax, or legal advice. Certain information contained in this presentation has been derived from third-party sources. While we believe these sources to be reliable, we make no representations as to the accuracy, timeliness, and completeness of any such information prepared by any unaffiliated third party incorporated herein, and take no responsibility therefore. As such, there is no guarantee that the views and opinions expressed in this presentation will come to pass.
All investments carry a certain degree of risk of loss, and there is no assurance that an investment will provide positive performance over any period of time. The statements contained herein reflect opinions, estimates, and projections of SMA as of the date hereof, and are subject to change without notice. SMA reserves the right to modify its
current investment strategies and techniques based on changing market dynamics or individual portfolio needs. The opinions expressed herein are those of SMA and are subject to change without notice. Information presented should not be considered as a solicitation or recommendation to buy or sell any security, financial product, or instrument discussed herein. Additionally, this material contains certain forward-looking statements which point to future possibilities. Due to known and unknown risks, other uncertainties, and factors, actual results may differ materially from the results portrayed or implied in such forward-looking statements. Furthermore, the illustrative results presented in this presentation in no way reflect the performance of any SMA product or any account of any SMA client, which may vary materially from the results portrayed for various reasons, including but not limited to, investment objectives, financial situations and financial needs of SMA clients; differences in products and investment strategies offered by SMA; and other factors relevant to the management of SMA client accounts.
This presentation and its contents are provided “as is” without warranty of any kind, express or implied, including, but not limited to, implied warranties of merchantability, fitness for a particular purpose, title, non-infringement, security, or accuracy. SMA reserves the right to modify its current investment strategies and techniques based on changing market dynamics or client needs. It should not be assumed that any of the security transactions, holdings, or sectors discussed were or will prove to be profitable, or that the investment recommendations or decisions we make in the future will be profitable or will equal the investment performance of the securities discussed herein.
Actual investment advisory fees incurred by clients may vary. A complete description of SMA’s fee schedule can be found in Part 2 of its FORM-ADV which is available at www.sagemountainadvisors.com or by calling (404) 795-4861. Clients are advised that no portion of the services provided by SMA should be interpreted as legal, tax or accounting advice. For legal and tax-related matters, we recommend that you seek the advice of a qualified attorney, accountant, or tax professional. SMA-23-000372